The digital medical image formation process
An image is a representation of reality. A medical image is an image used for a diagnostic purpose, thus must not only represent reality but be an accurate demonstration of it (Zheng, Glisson & Davidson, 2008). A digital medical image is one which is stored and manipulated in a discrete digital data form on a computer rather than a continuous analogue form.
A digital medical image may be obtained from general computer radiography. This is an indirect method and first, require the transmitted x-ray beam to interact with a phosphor layer which is within a radiographic cassette. The phosphor layer consists of very small crystals of photostimulable barium containing trace amounts of bivalent europium as a luminescence centre. When irradiated the phosphors fluoresce, transferring energy to the Eu2+ sites which are oxidised to form Eu3+ and the ejected electron is trapped within a conductive band. This electron pattern within the conductive band is the latent image.
The readout is the next step; the latent image is scanned by a red light which releases the stored electrons. The electrons then fall back into their original position, releasing the difference in energy as a photon, thus a light signal is produced. The light signal is collected with a photomultiplier tube (PMT). This process is called sampling, and is the first of the four steps involved in an analogue to digital conversion;
Sampling
A process of regular, periodic measurements whereby the analogue signal becomes digital. Frequency of the sampling is important, and a low sampling rate will result in a course signal void of subtle changes. The ability of the sampling process to yield an array of pixels depends upon the sample aperture which accesses a signal defined length of the signal/image while ignoring the rest of the signal/image, and the scan pattern which must be accurate.
Sensing
Light or X-ray is converted into electrical voltages or currents which are related to the original stimulus by a transducer. The photomultiplier tube also completes this step, and it also amplifies the signal. Sensing can also occur before sampling.
Quantising
Produces a series of discrete levels at each of the sampling points proportional to the signal, therefore determining the contrast resolution of the final image; the great the number of values given to award the greater the range of contrast.
Coding
Codes the discrete output levels of the signal resulting from the quantising stage into the particular digital format used by the computer system (bytes).
The image is now in a digital form ready to be displayed.
The chain of events in human image analysis
The psychological events in image analysis can be thought of as four events; Detection, Localisation, Recognition and Analysis (Zheng, 2008).
Detection involves the cognitive perception of a region of interest to be made. Visual information is acquired when light enters the eye, forming an image on the retinal surface, stimulating photoreceptors which in turn produce an electrical response. The structure of the eye is such that inaccurate perception of the environment, or in this case, a medical image, is minimised. The spherical retinal surface assures a ‘fisheye’ image is not formed, as would be the case with a planar linear retina due to the short focal distance and the wide-angle lens (Zheng, 2008).

Variations in the depth of field do not produce distortion/blurring as the ciliary muscles warp the lens and the papillary muscles vary the pupil aperture to adjust the focal length. When the ocular bulb is too small, or the lens is unable to relax enough, farsightedness results and the person is unable to focus on near objects as the eye cannot reduce the focal length enough (Walding, Rapkins & Rossiter, 2002, p. 405). Short-sightedness is caused when the ocular bulb is too large, or when the ciliary muscles can’t contrast enough, result in the focal distance of the object at a distance being too short.

Other perception problems which may affect a human observer viewing a medical image may be a result of the image and the viewing environment. For example, an X-ray film placed against a low-intensity light would lead to less than adequate saturation of the retina with photons. This results in a decrease in resolution due to the effect of a point source of light on the retina. When only one photoreceptor is depolarised in a given space, the ion shift, which results will cause it to act as a dipole.
The photoreceptor surrounding becomes inhibited and also act as dipoles, exciting to a lesser extent those surrounding the inhibited. So rather than a pinpoint source being perceived as a pinpoint of light, a blur surrounds the pinpoint. This decreases the overall image resolution.
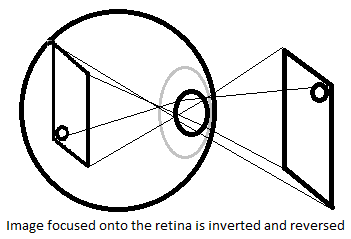
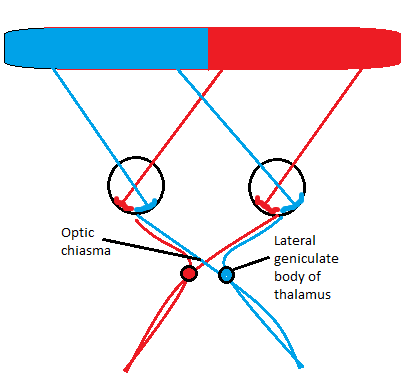
The image focussed on the retina is inverted and reversed. Photoreceptors chemically react to the different wavelengths of light, ultimately producing an electrical signal of the image, which travel down the optic nerve. At the optic chiasma the optic nerves converge, and the neurons which collected the visual signal from the medial section of each retina cross sides, as pictured, therefore information regarding the right visual field is passed to the left optic tract and visa versa.
The optic track synapses with the lateral geniculate body of the thalamus and then continue to the medial portion of the occipital lobe. In the occipital lobe, the information undergoes cognition. A number of the principle outlined by Gestalt allow for the localisation of objects within the visual field. Structures within the visual field of similar size, shape, luminosity, proximity or closed structures are seen to belong together. Again, this process may be affected by image quality and display conditions.
For example, the loss of resolution due to low luminosity explained before may result in two structures on a film which are both of low density and in close proximity may not be localised from one another and seen as the same structure. The resolving power of the eye, or, how close structures may be together and still be localised from one another, can be tested using a line grating test (Zheng, 2008).
Next are the steps of Recognition, which may require appropriate localisation, and then Analysis, both which depend on the prior experience of the human observer and occur in the anterior aspect of the occipital lobe (Zheng, 2008).
Physical parameters that impact the medical image quality
Medical image quality refers to the images ability to accurately report various states of disease or health and its ability to allow a radiographer to reliably detect relevant structures in the image. This quality is dependent on many factors, such as; spatial resolution, contrast resolution, signal-to-noise ratio (Zheng, 2008) the presences of artefacts and the accurate positioning of a patient for diagnostic purposes.
Contrast resolution is one physical parameter which has a significant effect on image quality. Contrast refers to the difference in density between two adjacent points on a film. An image of low contrast will not demonstrate subtle differences in subject contrast. Thus structures of similar density may not be localised from one another. For example, in an abdominal x-ray of low contrast, the psoas muscles may not be distinguished from the surrounding abdominal contents of similar density. Contrast resolution is ultimately determined by the number of levels of quantisations available for a pixel to be.
When viewing a digital image, the process of windowing revises the large range of quantisation values to a greyscale relevant to the human observer. Windowing allows a density (signal) range of interest to be selected from the large range of acquired densities (Carter, 1994, p191). This is known as selecting the window height, or level. The size of the range of densities can also be adjusted and is known as the window width. Varying the window width varies the contrast of the picture. Through windowing, the observer may review on a 6bit display an image containing up to 12bit of significant information.
Following windowing, image processing techniques may be used by the observer to enhance the contrast of an image. This is achieved by the application of an algorithm in which in most occasions the value of the new pixel is dependent on the value of the old pixel (a point operation). For example, with the application of a linear algorithm where k is the original quantise level of a pixel, and k1 is the new value, then k1=ak+b will increase overall contrast if a>1, and decrease it if a<1.
The value b applied a threshold for the pixel values (Zheng, 2008). Algorithms may also be non-linear. Histogram flattening (equalising) is a useful image processing technique for enhancing contrast when the pixels values are all very high, or very low. This method taken the existing image and using a point operation redistributes the existing pixels values so that there is an equal number of pixels at each quantised level.
Non-linear functions may also be used, like logarithmic functions, for example. Equalising or histogram flattening is another imaging processing technique used to improve contrast. It is useful when the image has pixel values all of the high or low values (e.g. The image is too dense or too light, either due to exposure factors or subject contrast). This technique can also allow for correct comparison of images.
Spatial resolution refers to the degree at which objects may be localised due to the sharpness of their borders. This may be affected by motion blur or geometric unsharpness. This resolution is also affected when converted to a digital form by variants such as the size of the matrix of pixel values, the speed and accuracy of the digitaliser (scanner), sampler and coder (refer to question 1) and the monitor resolution.
The spatial resolution may also be varied by digital image processing called spatial filtration. The edges of objects within an object can be described as abrupt changes in contrast, a high-frequency spatial component (Zheng, 2008). Here the output pixel is determined by both quantisation level (as within contrast enhancement) and spatial position; the values of the pixels surrounding the initial value. Simply, spatial filtration processes target areas with a high-frequency spatial component.
A low pass filter will ignore areas of low-frequency spatial components, blurring edges while increasing the visualisation of large objects. High pass filters enhance the high-frequency spatial components ‘sharpening’ the edges of objects and are otherwise known as edge enhancement. However, this may lead to apparent hollowing of objects.
Fourier transformation and the image processing techniques in frequency space for medical imaging applications
Fourier transform is utilised in medical imaging to extract time and spatial and domain data into the frequency domain, decomposing the image into sine and cosine components (Zheng, 2008). A Fourier transform analyses a digital signal in the domain of time to produce a frequency wave of its spatial content. All objects within an image can be considered to have frequency relationships.
We may consider this test object;
When this test object is read-only in the x-axis, the following intensity vs distance graph may be produced;

By comparison to the frequency relationship to the right when the same signal is read over x amount of time it can be seen that the object size relates to one wavelength; thus the smaller the objects, the higher the frequency.
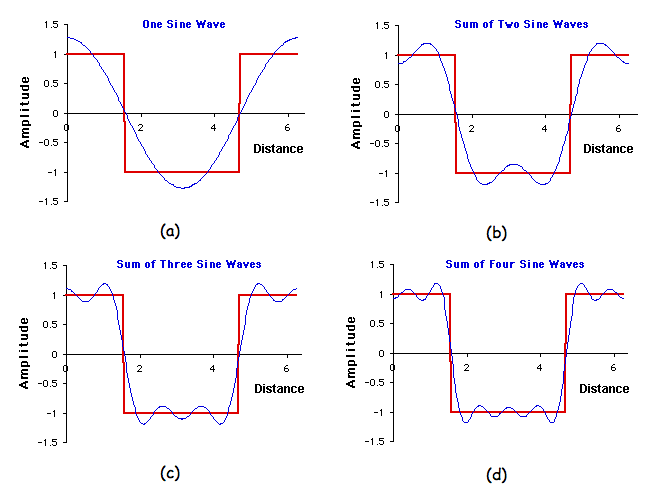
Summation of sine and cosine waves can further represent the image. For example, if one considered the blocks above which results in a squared plot on an intensity vs distance graph, this can be replicated by the addition of four sine waves, as seen in figure #.
The resultant information may be demonstrated in a spectrum of frequency vs amplitude.
So in this Fourier domain, each point in an image is represented by a particular frequency in the spatial domain, and the number of frequencies corresponds to a number of pixels in the spatial domain. Thus the Fourier transform is computational and allowing for easy image manipulation. For example, once a Fourier spectrum has been generated for an image, it can be filtered so that certain spatial frequencies can be modified. These spatial frequencies may be enhanced or suppressed to produce images of sharper or smoother features.
By applying functions which cut out certain frequencies and amplitudes, noise can be reduced, and contrast of small detail can be enhanced. Once processing is complete, an inverse Fourier may be applied to demonstrate the image again in a way we may view it.
Convolution and the image processing techniques in spatial space for medical imaging application
Convolution is the modification of a pixel value based on the values of its surrounding pixels, and it is often used as an image processing technique to increase the image contrast (Zheng, 2008).
A specific pixel, of location (x,y) which we may call k has a quantisation level of its own. The surrounding pixels, A-H, also have their own quantisation levels. A filter matrix of predetermined values is mathematically applied to determine the new central pixel value. This matrix of predetermined values is known as a mask or a kernel. The new pixel value will be the arithmetic sum of the nine-pixel values, the specific pixel itself and all those adjacent, each multiplied by a filter coefficient value (Zheng, 2008, p. 89).
There are four main types of masks/kernels which may be applied;

High pass spatial filtering- These tend to selectively enhance image features with a relatively high-frequency component while attenuating those features with a low frequency. This will increase the definition of edges within the image, yet this will also increase the amount of random noise.
The following mask/kernel reflects such a filter; is a typical pixel value matrix.
The sum of all these values is equal to the new value for x1; -29.5. As a (-) value is not valid, the new pixel value will, in fact be 0. The transition between x1 and x2 would represent an edge, due to the large difference in values. The following diagrams demonstrate applying the above filter to values X1 and X2; -1.(0.5).10
The sum of all these values is equal to the new value for x2; 44.5
It is obvious that the high pass filter has greatly increased the contrast between these two points.
- Low pass spatial filtering- Is the opposite to high pass filtering as it tends to smooth abrupt contrast transitions.
- Median filtering- Are designed to reduce images noise without edge enhancement. The new pixel value is the median value of the nine-pixel values. Therefore these filters can increase image detail where high amounts of noise artefacts are present.
- Simple feature detection- enhances selective features such as vertical edges within an image or horizontal edges within an image.
PACS and its four major components
The Picture Archiving Communication System, or, PACS is comprised of hardware and software that involves image acquisition, archiving, digital communication, image processing, the retrieval and viewing of images and the distribution of these images. PACS and other IT technologies can be used to improve health care delivery workflow efficiency. This results in a reduction of operating costs as well as speeding up health care delivery (Feng, 1996, p. 279).
A PACS system can be said to consist of four components; an image and data acquisition gateway, a PACS controller and archive, a display workstation and the digital network that integrates them all together (Feng, 1996, p.286).
The Image and data acquisition gateway involves the correct images from the imaging modalities and the related patient data (from HIS and RIS) being acquired by the PACS. The term ‘gateway’ is used because this component of the system only allows information compatible with the PACS network (e.g. DICOM images).
From the image and data acquisition gateways the information is sent to the PACS controller and archive (Feng, 1996, p.287). Major functions of this component include;
- Extracts textual information describing the relevant information
- Updates a net-work-accessible database management system
- Determines which workstations the information should be sent to
- Automatically retrieves images relevant for comparison and forwards them to the relevant workstations.
- Determines optimal contrast and brightness parameters for image display
- Preforms image data compression and data integrity test is necessary.
- Archives new examination information onto a long-term archive library
- Deletes images which have been archived from the gateway computers after a period of time

Display workstations include a local database, resources management, display and processing software. Functions performed at such a workstation include case preparation, image manipulation and improvement, and image interpretation and documentation. For example, workstations include the radiographer’s PACS access for printing, reviewing and manipulating images, and the radiologists for image interpretation and documentation (a higher resolution screen for display is used at these work stations).
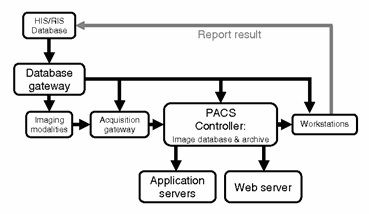
Figure 3- PACS integration (Feng, 1996, p.286) Communication and networking is an important function of the PACS. It allows for the previously described flow of information, and it also provides an access path by which end users (e.g. clinicians and radiologists) at one geographic location can access information at another location.
IHE and the relationship between the DICOM, PACS, RIS, HIS
A digital radiology department has two components, the radiology information management systems, or the RIS and the digital imaging system, the PACS (Feng, 1996, p.280).
The RIS is a subset of the hospital information system, otherwise known as the HIS (Feng, 1996, p.280). The HIS is a comprehensive information system designed to manage the administrative, financial and clinical roles within a hospital. The RIS performs the same function but within the radiology department. Information from these systems is acquired by the PACS system and integrated with the information obtained from the imaging modalities, as seen in the above figure 3 in question 7.
DICOM, which is an acronym for Digital Imaging and Communications in Medicine Standard are hardware definitions and software protocols and data definitions which aim to facilitate information exchange, interconnectivity, and communications between medical systems (Feng, 1996, p.282). Medical imaging companies must abide by these protocols in digital information creation so that all medical imaging hardware and software may communicate with one another. One particular example of this is the.DICOM formatted image. Other standards, the DICOM model of the real world, describes a framework of imaging facility management which software is programmed to facilitate.
An IHE (Integrating and Health Care Enterprise) is neither a standard nor a certifying authority; rather, it is an information model to enable the adoption of DICOM standards. An example of a component of IHE would be common vocabularies which would then facilitate health care providers and technical personnel in understanding each other.
10 Integrating and Health Care Enterprise components, each of which has a model which the management of an imaging facility may follow:
- Scheduled workflow.
- Patient information reconciliation.
- Consistent presentation of images.
- Presentation-grouped procedures.
- Access to radiology information.
- Key images and numeric report.
- Basic security.
- Charge posting.
- Postprocessing workflow.
Bibliography
Feng, D. (2007). Biomedical Information. London: Academic Press.
Carter, P. (1994). Chesney’s Equipment for Student Radiographers. Oxford: Blackwell Publishing.
Walding, R. Rapkins, G. Rossiter, G. (2002). New Century Senior Physics. New York: Oxford University Press.
Zheng, X. Glisson, M. Davidson, R. (2008) Applied Imaging- Study Guide. Wagga Wagga: Charles Sturt University.