Aim
This experiment aimed at establishing the effect of pH on the solubility of proteins.
Procedure
The protein precipitate was prepared by adding water to 2 g of lupin flour. The volume of the mixture was made to 200 mL in a measuring cylinder. Parafilm was then added, and the mixture was thoroughly mixed by inversion until all of it was uniform. The suspension was transferred to a 500 mL beaker, and the pH was adjusted using NaOH. A plastic transfer pipette was used to add small amounts of NaOH until a pH of 10.5 was achieved. The pH of the protein suspension was adjusted to the assigned pH using HCl while taking care not to overshoot. A 5 mL sample was taken and added to a 10 mL centrifuge tube and mixed gently by inverting the tube for 5 minutes (James, 2013). The sample was centrifuged after which the supernatant was transferred to a different tube.
The concentration of the protein in the supernatant was determined using a biuret reagent. 1 mL of the supernatant and 3 mL of biuret reagent were added to a clean test tube mixed and left to stand for 15 minutes. A blank was used to ‘zero’ the spectrophotometer after which the absorbance of the sample was determined at 540 nm.
Results and Calculations
The concentration of protein in the sample was calculated by substituting into the standard curve equation of the form y=mx +c where ‘m’ was the slope of the curve (0.0705), ‘y’ was the absorbance, ‘x’ was the concentration, and ‘c’ was the y-intercept (0.0215).
0.132=0.0705 (Concentration) +0.0215
Concentration= (0.132-0.0215) ÷0.0705
Concentration=1.567 mg/mL
The concentration in mg/mL was multiplied by 200 mL. This gave the concentration of soluble protein in the lupin flour. This value was then calculated as a percentage of soluble protein in lupin flour by assuming that lupin flour contained 60 % (w/w) protein.
1.567mg/mL ×200 mL=313.4 mg.
% soluble protein= [313.3÷1201.26]×100
=26.08 %
Figure 1: Table of Percentage Solubility at Varying pH.

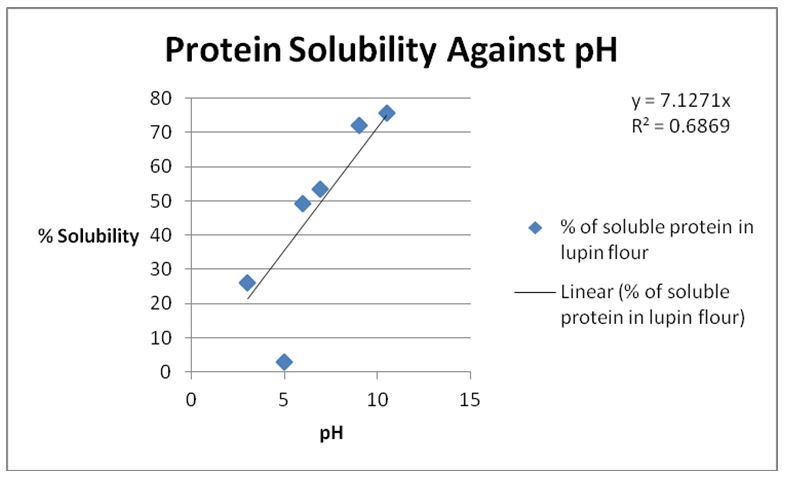
It was observed that the solubility of lupin protein increased with the increase in the pH of the solution.
Discussion
The biuret test was an important test for soluble proteins because it revealed the presence of peptide linkage by the formation of a bluish-violet color (Chauhan, 2008). The intensity of the bluish violet color indicated the amount of soluble protein present in the sample. It was realized that the solubility of proteins increased with the increase in pH. This was attributed to the presence of hydrophilic amino acids such as arginine, lysine, glutamate, and aspartate that are present on the surface of protein molecules (Chauhan, 2008). At any given time proteins have net charges on their surfaces that depend on the pH and number of charged amino acids (Protein Solubility, n.d.).
A protein has the lowest solubility at its isoelectric point, which is the pH where the total positive charge is equivalent to the total negative charge (Myerson, 2002). This is usually between pH of 5.5 to 8 (Protein Solubility, n.d.). This was the reason that the least solubility was observed at a pH of 5. As the pH of the solution increased, the proteins were more soluble because they had more hydrophilic amino acids interacting with water (Chesworth, Stuchbury, & Scaife, 1998).
Mixing the protein samples by inversion allowed the proteins to dissolve. It was necessary to centrifuge the samples after mixing to separate the soluble proteins in the mixture from the insoluble part.
Conclusion
It was concluded that proteins were sensitive to alterations in pH and that an increase in pH resulted in increased solubility of lupin proteins.
References
Chauhan, B. S. (2008). Principles of biochemistry and biophysics. New Delhi: University Sciences Press.
Chesworth, J. M., Stuchburt, T., & Scaife, J. R. (1998). An introduction to agricultural biochemistry. London, UK: Chapman & Hall.
James, T. (2013). Food Chemistry 281 laboratory manual 2013. Curtin University: Faculty of Health Sciences.
Myerson, A. (2002). Handbook of industrial crystallization (2nd ed.). Woburn, MA: Butterworth-Heinemann.
Protein solubility. (n.d.). Web.