Introduction
This project was undertaken to enable the classification of finger actions and gestures using a simple classification method that uses EMG to transmit signals due to the movement of finger actions and gestures using a Flexcomp system. The target tasks used in the classification method were the key grip, hand open, pinch grip, cylindrical grip, spherical grip, and finger grip gestures. The system was able to receive and function on EMG signals from the different student who participated in the project using a set up with classification items for the simple transmission of EMG signals. To make the set up to function as required, a cyber-glove EMG electrode was connected to the hand and the system to optimise the results.
According to Lee, Wilson, Lock and Kamper (2011, p.10), the target application was to assist any person whose upper limbs have been rendered immovable because of a stroke and to use their hands despite being in a paralytic state. In most cases paralytics often recover rapidly from the effects of paralysis of their lower limps, but the recovery and use of their arms and hands sometimes takes longer or do not experience full recovery.
The condition makes it difficult to use the upper limbs of their bodies, necessitating the need to seek for support to perform simple tasks. To address the problem, the current classification experiment was designed to use simple classification strategies for simple EMG signals system was developed to assist in the functioning of the hand to perform different tasks for patients to support themselves.
In the past, the classification was done by mapping the EMG of one muscle, but with new ideas, the current method involves more variables and not one with a single degree of freedom.
A classification strategy, working on predetermined requirements was used to develop the system by focusing on the classification function method. The classification function method works on the principles of the movement of the muscles of the hand. The salient features were designed into the system to make it work appropriately include the classification algorithm, electrode placement, and signal processing.
Methods
The system was set up by placing the electrodes on different positions of the arms and hands as shown in the pictures, to address the classification for the execution of the following tasks: hand open, key grip and spherical (ball) grip. The diagrams below show the hand and arm electrode placements respectively. EMG senses the muscular activity through the electrical signals that are generated and transmitted from the surface of the skin due to the potential difference between the electrodes as shown in figures 1, 2, and 3 below.
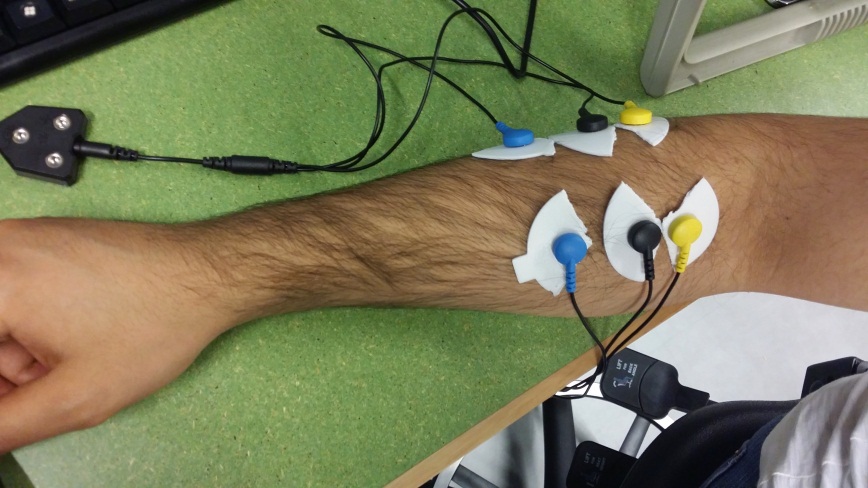
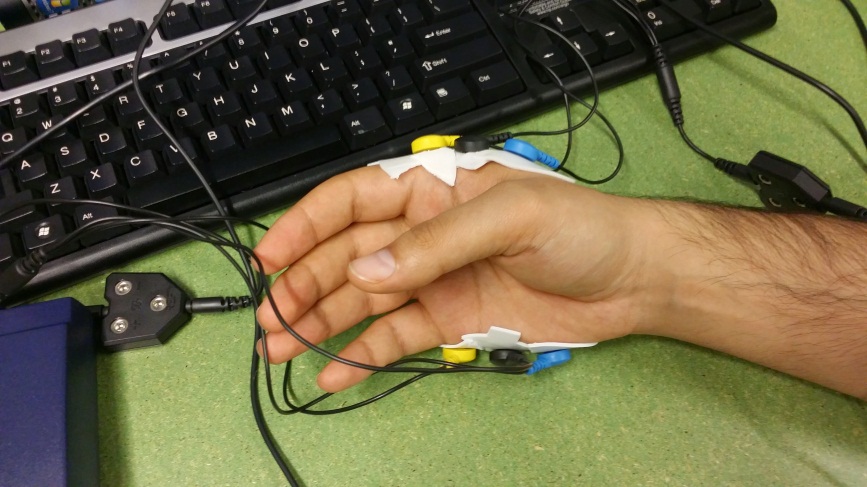
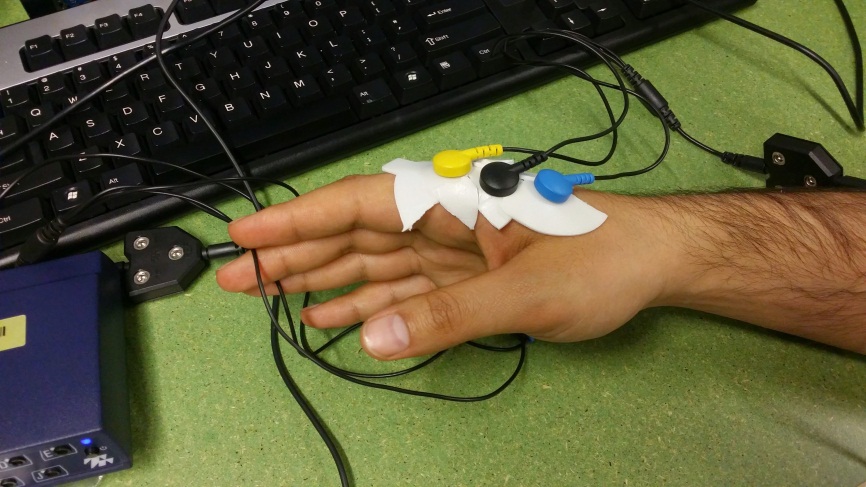
EMG signals were identified to be caused by variation of muscle contraction efforts, muscle fatigue, and electrode location and movement disturbance. When the electrode placement was done, it was important to ensure that the pressure exerted on the arm by the electrode did not exceed the 50 mmHg level. The pressure was maintained at the 50 mmHg not to cause any harm on the arm, hand, or muscle.
To ensure that the pressure was maintained at a minimum, the electrodes were placed on specific points of the arm and the hand. The “hand positions that were used are the independent flexion of each of the four fingers” (Fleischer & Hommel 2008). The overall movement of the fingers have already been mentioned to ensure that the system collects and processes data on the movement of the pointer finger, the middle finger, the ring finger, the and the movement or flexion of the middle finger.
The movements were caused by the action of the muscles on the fingers and the flexor digitorum superficialis (to manipulate the movement of the index finger), lexor palmaris longus (to manipulate the movement of the middle and ring fingers), flexor carpi radialis (which ensures that the middle finger moves appropriately), and the other muscles that control and coordinates the movement of the remaining parts of the arm.
The software, referred to as Mat lab was used to analyse the data that was generated from the study. According to Blok, Van Dijk, Drost, Zwarts and Stegeman (2002, p.34), the tests were crucial in classifying the execution of the tasks.
Implementation
Different placement tasks were done, yielding different results and the best outcomes were recorded. Investigations were started using the hand open tasks and signals that were transmitted from the disturbances of the muscles due to the potential difference between the electrodes on the hands and arms. The tasks were performed three times for each of the three subjects, i.e. Subject 1, subject 2, and subject 3 and the best results were recorded. Each of the task caused disturbances that generated signals according to the ball grip tasks, hand open tasks, ball grip tasks, and key grip tasks for each of the three subjects and the best results were recorded for analysis.
The insertion procedure was to place three pairs of the electrodes on the hands. In addition, seven pairs were placed on the forehead. However, the metacarpal (MC) provided the specific position to place the first position to place the electrodes. The placement position was the thenar muscles and the second placement position was the first dorsal interosseous muscle (Silva, Heim & Chau 2005). The “posterior side of the forearm where the radius, ulnar and lunate bones meet” provided the second position to place the next electrode” (Siemienski, Kebel & Klajner 2006). In addition, it was important to ensure that the electrodes were equally spaced to cover the whole circumference of the forearm.
Tests
The set up was tested using a testing strategy by ensuring that the participants were made to sit comfortably on their chairs. Each participant was required to rest the arms on a table that was positioned according to the height of the subject (Silva, Heim & Chau 2005). Then the participants were required to perform the tasks that were specified for them. The typical tasks were “grip and open, key grip, pinch grip, cylindrical grip, spherical grip, and three-fingered grip” (Fleischer & Hommel 2008). The subjects were required to participate in the study in three sessions and in each session the participants were trained on how to perform the tasks. It was deemed necessary for each participant to perform the test in 7 and 20 seconds.
Classification
The classification was done by configuring the system to manipulate the data that was collected when the experiments were made top start. When the experiments were done, EMG signals were collected and computed by using the data from the different tasks. It was deemed convenient to conduct pattern classification processes to ensure that the output from each session was in accordance with the requirements expected from the sessions. Each session was executed by the use of subject-specific LDA classifiers. In addition, the data that was collected in each session was analysed to determine the intent of each movement of the arm ant its intent to move.
EMG signal processing
The EMG signal processing that is generated from the study is discussed below.
Signal processing
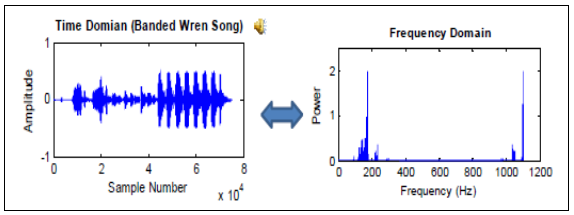
The signals generated from the experiment were analysed based on the Time and Fourier Domain Analysis by converting raw EMG data into time-independent data sets on a time frequency plane. The raw time domain signals were sampled at a rate of 1000 sampler/second and the frequency range was 500 Hz. The frequency energy was between 2-200 Hz for each of the tasks performed according to the task classifications. Butterworth band pass filter (10-250 Hz) was used to reduce the phase shift and the frequency normalisation was done to group them into buckets to calculate average energy for each bucket. A multiclass support vector machine was used to classify the signals and the second was the time dimension for measuring time as shown in figure 4 and 5.
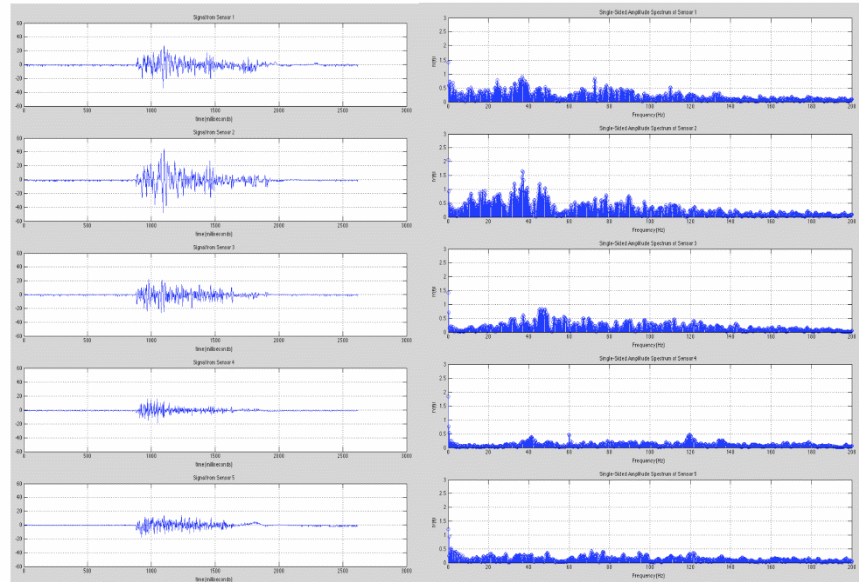
The conversion of the time domain signals to frequency domain signals is illustrated in figure 6 below.
Data analysis
Before the data was analysed, it had to be cleansed of the EMG electrical noise factors that interfered with the results. Prior to amplification, the amplitude range of EMG signal was 0-10 mV (+5 to -5). The noise signals removed were ambient noise, motion artefacts due to data irregularities, electrode interface, electrode cable, inherent instability of the signal, and inherent noise of electronics equipment. Other factors were causative, intermediate, and deterministic. The data was then smoothed with a width of 2 seconds to improve the quality.
Causative factors have a direct effect on the quality of EMG signal and the quality of data. The causes of causative problems are caused by intrinsic factors such as biochemical, anatomical, physiological, blood flow, depth and location of active fibres, the electrode, and the amount of muscle between the electrode and the surface of the muscle (Saponas, Tan, Morris & Balakrishnan 2008). On the other hand, intermediate factors that were considered in the study include the physical and physiological phenomena. Deterministic factors were caused by motor firing rate, duration, amplitude, motor action, motor firing rate, and the mechanical interaction with a direct bearing on EMG signal and the interaction between the muscles (Saponas, Tan, Morris & Balakrishnan 2008).
Results
The data was cleaned through a filtering process based on the high corner frequencies of 10, 20, 30 Hz. After that, the data was normalized after filtering with a high-pass, which was filtered at 1 Hz. Different filter scopes were used to filter the EMG signals.
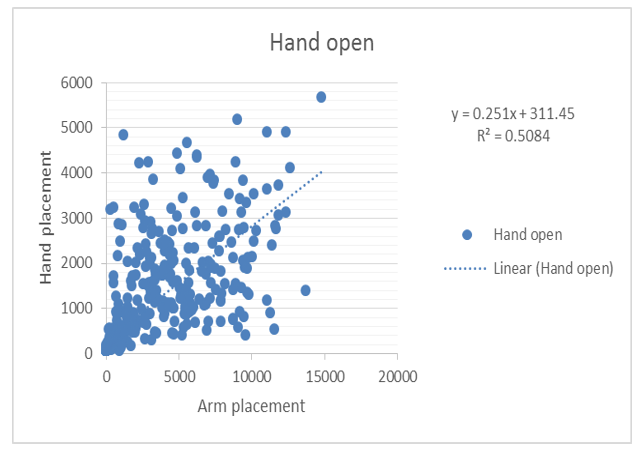
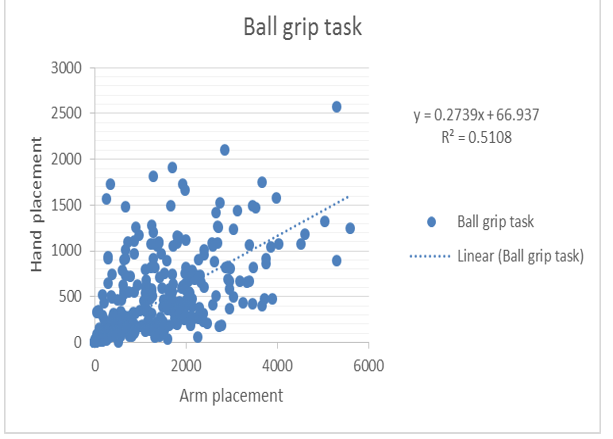
The tasks that were tested include key grip, hand open, pinch grip, cylindrical grip, spherical grip, and finger grip gestures on different hand placements and the results are summarised in the following tables.
Ball grip task (student 1)
The results shown above were analysed on the graph of arm placement vs hand placement in the performance of the ball grip task. The results show a correlation of 0.60503 and the value of R2 to be 0.3661, which shows a strong relationship between the position of the electrode, the movement of the hand, and the strength of the signals generated by the grip. However, it can be noted that most of the points are outside the linear relationship line. According to the results, R2, which is the square of the coefficient of multiple correlations, is used to determine the relationship between the data that lies between 0 and 1. The results show that R2 is smaller than 0.5, which shows that the goodness of fit of the results is small and most of the values are below 0.5.
The results show a correlation of 0.60503 when the hand performed a ball grip task with the electrodes was placed on the arms. The results are summarised in the tables below.
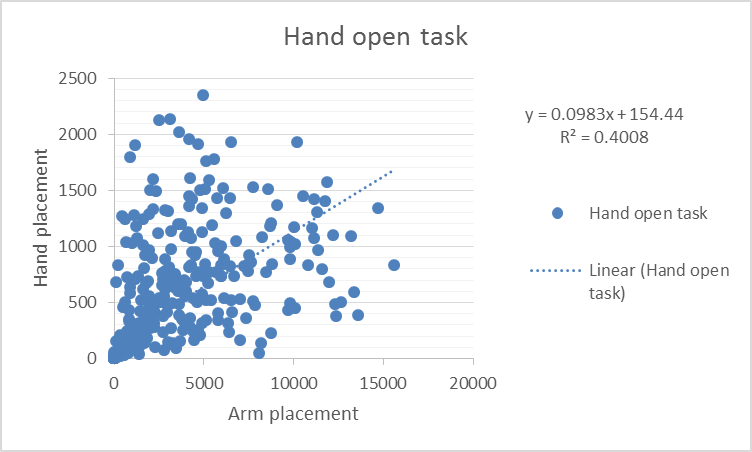
For the graph shown below, the correlation is 0.633071R2 is 0.4008
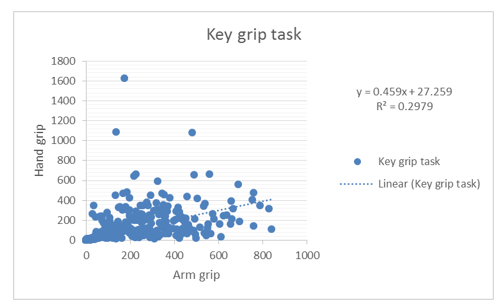
On the other hand, the results for the key open task are shown in the following graph. The correlation between hand grip and the arm grip is 0.54581 and the value of R2 is 0.2979. The results show that the hand grip and the arm grip have a low correlation and that the grip of the hand does not have a strong impact on the grip of the arm. When the value of the grip is below 0.5, then it can be interpreted to mean that the strength of the grip of the arm is not influenced by the strength of the grip of the hand. When performing the key grip tasks, the correlation between the hand grip and the arm grip was established to be 0.545814. The maximum value obtained on the horizontal axis for the
Results for Student 2
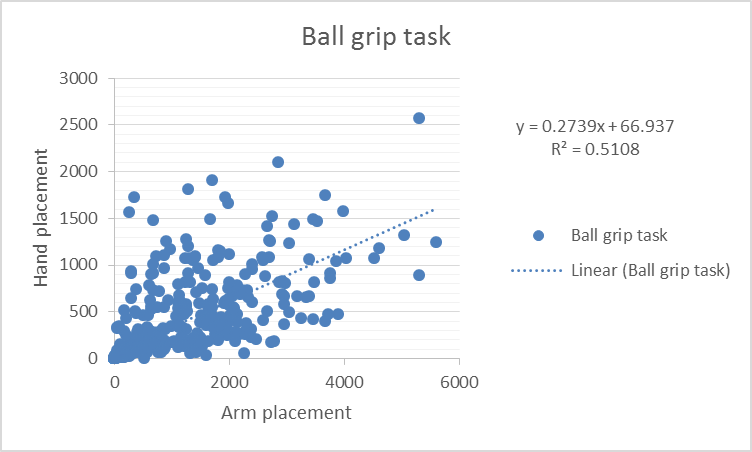
Correlation results for student 3
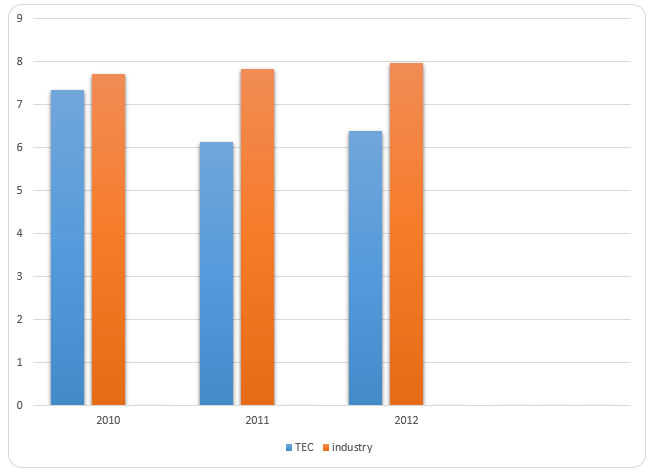
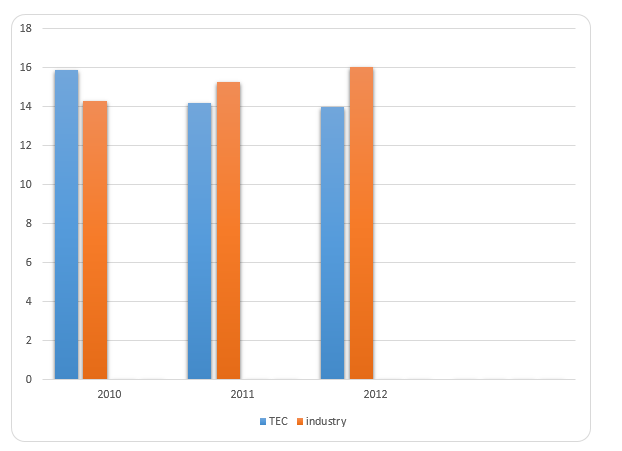
Once the tests were done, a lot of data were yielded to address the research problem in the following discussion. Each result of each subject consists of the four numbers for each participant in the test. The data was collected from each participants and the RMS, MAV, Fmean, Fmed were then calculated by involving each of the elements being investigated based on the movement of the arms. Different amplitude factors were also factored into the analysis of the results. In addition, the amplitude of each of the readings of the EMG signals was recorded. The amplitude of the EMG signals was left constant to ensure that the sampling rate was kept constant.
The results are shown in figure 8 below. It is important to note that the system did not show any chaotic and that led to the median frequency of the results. It is important to note that five curves were the result of the experiment and they vary from each other by 5%. The traced results depend on the vastus medialis EMG signal, which is the sampling rate that is created by the movement of the muscles on the arm.
On the hand, the inter-task variability showed that the strength of the grip was higher for people with strong impairment than the ones who had low impairment levels. On the other hand, the strength of the grip based on a correlation analysis of inter-task variability under the same type of grips showed no differences in the strength of the grips.
Classification accuracy
The accuracy of the classification across the different groups of students relied on the number of training session that the student was subjected to. In addition, the classification level was achieved using Fast Fourier transform (FFT-based signal analysis). The classifier was able to distinguish subject specific grips performed by the different students who participated in the study.
Conclusion
The simple classification process was made successful by the use of data that was generated from the electromyography (EMG) sensor because of the actions of the fingers due to the gestures using the Flexcomp system to address the problem of people with different paralytic impairments. The tasks used in the study were “hand open (HO), key grip (KG), pinch grip (PG), cylindrical grip (CG), spherical grip (SG), three-fingered grip (3G)” (Fleischer & Hommel 2008).
Each subject who was asked to participate to generate the data for classify the system in this study had a specific degree of impairment. It was established from the study that the number of sessions used for classification training sessions did not show any effect on the accuracy of the results. When the classifier sessions increased, the accuracy of the data that was collected from the test increased. Because the significance level of the frequency of the training sessions had little impact on the classification results, it was established that shorter training seasons were enough for the study. The results could be improved of if the quality of EMG signals were improved by removing various disturbances such as electrical noise.
In addition, if amputees were the included into the study to provide greater disturbances and increase the amount of electrical signals in an enabling environment, the EMG signal strengths could increase and the put could increase. However, it is recommended that future studies be concentrated in the subject-specific classification areas by considering both the psychology of subjects and the functionality of specific target tasks.
The classification performance was relatively good, but required further refining to increase the quality of the results. It was also possible for subject specific classifiers to distinguish different tasks such as grip vs hand open grip tasks. However, it is worth noting that some of the results were almost similar for some students because the grips were readings almost the same. Those results occurred between the pinch and key grips and the cylindrical grips. It was therefore possible to classify the “power grasp-type” with the spherical grips. However, the classification of other types of grips was in the category of “pinch-type” and included three fingered grips, pinch, and key tasks.
The classification categories were reduced from seven to four (open, no movement, pinch, power grasp) the quality of the results improved drastically. Using EMG for simple pattern classification could not generate results that could be applied across different, but established that each EMG has to be designed for each task separately. It was also established that electrode position was important and should be considered depending on the motor controls of each subject and should specifically target proximal muscles for better signal generation and classification.
References
Blok, JH, Van Dijk, J. P, Drost, G, Zwarts, M J & Stegeman, DF 2002, A high-density multichannel surface electromyography system for the characterization of single motor units. Review of scientific instruments, 73(4), 1887-1897.
Fleischer, C & Hommel, G 2008, A Human–Exoskeleton Interface Utilizing Electromyography. Robotics, IEEE Transactions on, vol. 4, no. 24, pp. 872-882.
Lee,SW, Wilson, KM, Lock, BA &. Kamper, DG 2011, Subject-Specific Myoelectric Pattern Classification of Functional Hand Movements for Stroke Survivors, IEEE transactions on neural systems and rehabilitation engineering, vol. 19, no. 5, pp. 34.
Saponas, TS, Tan, DS, Morris, D & Balakrishnan, R 2008, Demonstrating the feasibility of using forearm electromyography for muscle-computer interfaces. In Proceedings of the SIGCHI Conference on Human Factors in Computing Systems, vol. 1, no, 1, pp. 515-524.
Silva, J, Heim, W & Chau, T 2005, A self-contained, mechanomyography-driven externally powered prosthesis. Archives of physical medicine and rehabilitation, vol. 10, no. 86, pp. 2066-2070.
Siemienski, A, Kebel, A & Klajner, P 2006, Fatigue independent amplitude-frequency correlations in EMG signals. arXiv preprint physics, vol. 1, no., 0611120, pp. 1-20.