Introduction
This is financial statement analysis of two companies in telecommunication industry operating in different countries. Etisalat is a company which is listed in United Arab Emirate Stock Exchange and AT&T Telecommunication is listed in New York Stock Exchange. The companies work under different social economic environment although they are in the same industry. This report will provide information to potential investors about investing these companies. Creditors of these companies may find some of the information important especially if the companies are borrowing money to invest in the same country (ICFAI Center for Management Research ICMR., 2004).
Telecommunication industry has seen an increase of competition from companies such as Mobile Companies, Internets Companies and Entry of Telecommunication Company from other countries into the local market. The information from this analysis will help us in understanding and evaluating changes in financial accounts of the two companies. The unusual events affecting operating income, trends or uncertainties affecting or likely to affect operations and impending changes in revenue and expense relations will be noted (Blander, 1994).
Ratio Analysis
Profitability
As far as profitability is concerned, Etisalat has shown a decrease in profitability from the year 2006 to the year 2007. The profit margin was 35.97% in the year 2006 it fell to 34.19% in the year 2007 below slitting further to 33.17% in the year 2008 and it settled at 28.66% in the year 2009. The return on asset and return on equity had more or less the same behaviour because return on asset was 12.76% in the year 2006, in the year 2007 it was 13.91%, in the year 2008 it was 12.38%. This shows that the profit of the company were lower. Return on equity shows that the company had 27.39% in the year 2006.
Looking at the profitability of AT&T you will not that return on equity fluctuated from 6.37 to 12.25 in the year 2006 and the year 2009 respectively. The return of the equity of this company appears to be almost the same as that of Etisalat. The net profit margin of this company appears to be reducing although in a minimal trend. It fell from 11.67% in the year 2006 to 10.05 in the year 2007, 10.37 in the year 2008 before settling at 10.19 in the year 2009.
The return on asset of this company as increased over the four years although it was the highest in the year 2008 at 4.85%, 4.66% in the year 2009 and 4.42% in the year 2007. These three ratios have shown a tremendous decrease which is a sign of poor performance of the two companies. However it should not escape our mind the year 2007 to the year 2009 there was a financial crisis in the world; therefore a poor show or a poor result during the period may be attributed to this.
Liquidity ratios
Both companies Etisalat and AT&T Telecommunication have maintained poor liquids in their financial statement. This is shown by the current and quick ratios (Fontes, 2005). The quick ratio recommended the fraction if 2 to 1, but these companies have a current ratio of less than 1 to 1. This means that there are poor performances in terms of liquidity. The table below shows their current ratios.
As it can be seen from the current ratio both companies are maintaining poor liquidity as the ratio is 2 to 1.
Looking at quick ratio both companies are showing a ratio which is less than 1 to 1 in all the years. This means that the company cannot make short term obligations as they fault you. The ability to offset this short term obligations is in question in both companies although there are from different countries. These ratios are shown below
From the table above it can be noted that the ratios are lower than 1 but also it is almost equivalent to the current ratio. With the above commutation it is clear that both companies ability to pay short term liabilities from the year 2006 to the year 2009 is in question. The quick ratio is decreasing which is an indicative of a negative result.
Asset utilization
Asset utilization ratios for both companies include receivable turn over, average collection period, fixed period turn over and total asset turn over. This ratio is the number of days in which the company collects revenues from account receivable holders (Fridson and Álvarez, 2002). It gives users of financial statement a picture on the efficiency of the management in generating cash inflows from debtors. The account receivable turn over for Etisalat has been decreasing from 25.81 in the year 2006, times 13.06 in the year 2007 while in the year 2008 it was times 11.77. However, it is settled at times 9.45 in the year 2009.
AT&T appeared to be improving its ratio from 3.89 to 7.35 in the year 2007 while in the year 2008 it was 7.73 and 2009 it was 8.21. Average collection period for Etisalat appears to be increasing. AT & T fixed asset turnover ratio is fluctuating from time to time. From a rate of 0.67 times in the year 2006 it has increased to 1.24 times in the year 2007 further to 1.25 times in the year 2009 and settled at 1.23 times in the year 2009. This means that fixed assets is not being used as often as it should be.
Debt utilization
The two company’s debt utilization ratios present a very pleasing sight to the shareholders. The debt to equity shows how much protection there is for creditors. To calculate this ratio total reliabilities of the company is expressed as a percentage of total shareholders’ funds (Ormiston and Fraser, 2004). The debt to total equity ratio of AT & T shows that the firm has recently reduced on some debt and it far outweighs the Equity that it has raised. This a risky capital structure to have and AT & T would be advised to focus on raising funds though Equity rather than debt.
AT& T shows that this ratio was 1.34 times in the year 2006, 1.39 times for the year 2007 while the year 2008 was 1.74 times and in the year 2009 it was 1.63 times. In the case of Etisalat the ratios were 1.15 times for the year 2006, in the year 2007 it was 1.03 times while in year 2008 it was 0.85 times before settling at 0.77 times in the year 2009. The riskiness of the capital structure is reducing for this company. It shows how the creditors will be covered by owner’s equity during time liquation. In both years they are showing high risk.
The debt to total assets ratios demonstrates that both companies have enough Assets to cover its debt sufficiently in case of potential insolvency. The ratio for AT & T is 0.57 times in the year 2006, in the year 2007 it was 0.59 times it went up in the year 2008 to 0.64 and declined to 0.62 times in the year 2009. For Etisalat it was 0.53 times, 0.51 times, 0.45 times and 0.43 times for the year 2006, 2007, 2008 and 2009 respectively.
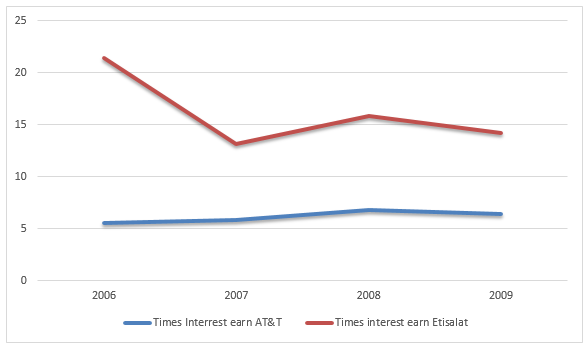
The interest cover ratio has improved for both companies as it now shows that the interest that Etisalat owes to creditors every year, it made 21.38 times that amount in 2006, 13.14 times in the year 2007, 15.38 times in the year 2008 and 14.23 times in the year 2009.
The interest coverage for AT & T was 5.58 times, 5.82 times, 6.80 times and 6.36 times for year 2006, 2007, 2008 and 2009 respectively. This ratio was increasing drastically.
Market Ratios
Dividend payout ratio is used by potential investors the portion of profit and that is distributed as dividends. Etisalat in 2006 the Dividend payout ratio was 35%, it increased to 39% in the year 2007, in the year 2008 was 37% and in the year 2009. There was a marked increase each year showing that the company’s dividend payout ratio was being increased although decline in profitability.
In the case of AT & T it was 70%, 73%, 74% and 77% for the years 2006,2007, 2008 and 2009 respectively. it has the highest payout ratio as compared to
Cash flow analysis ratios
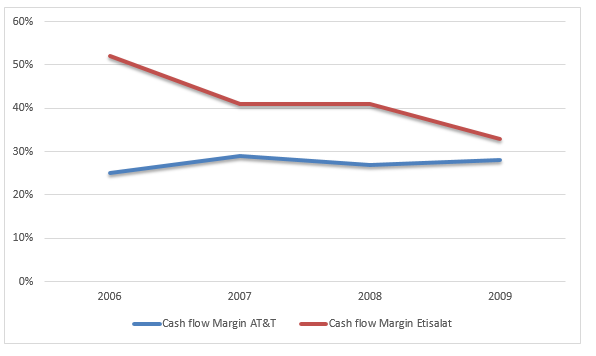
The cash flows margin of AT & T reveal that the company has been successful in improving its cash flow from sales during the year 2009 and 2007, when compared with the year 2008 and 2006 which had a significant decrease in the cash flows margin. These ratios were 25%, 29%, 27% and 28% respectively. In the case of Etisalat, there is a decrease cash flow margin from 52%, in the year 2006 to 51% for the year 2007, in the year 2008 it was 41% and in the year 2009 it was 33%. Despite this fact, the cash flows margin for Etisalat cannot be described as poor although it showed a significant decrease in cash flows when compared with AT& T.
Degree of leverage
Degree of leverage is a percentage change in earnings before interest and tax divide by change in sales.
DOL = % change in operating income percentage change in sale
Etisalat.
AT&T.
Degree of financial leverage
Degree of financial leverage shows the change in earnings before tax divide by earnings before interest and tax.
Etisalat.
AT&T.
Trend Analysis
This is a useful tool in assessing persistence of performance either in total or by segments is trend percent analysis. Looking at profit margin for the company their trend was as shown below
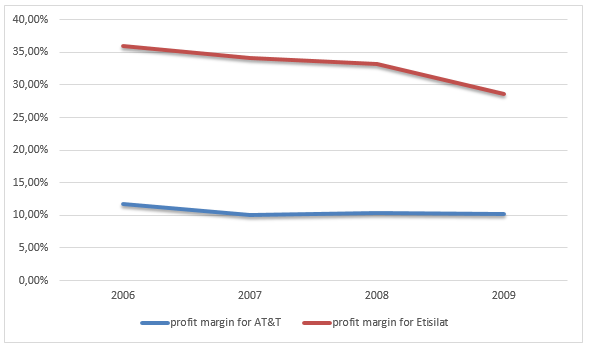
From the graph above it can be observed that Etisalat has a downward trend as compared to AT& T which a fairly stable trend. However, return on equity, return on assets Etisalat has a better trend as compared with AT & T as shown by the chart below;
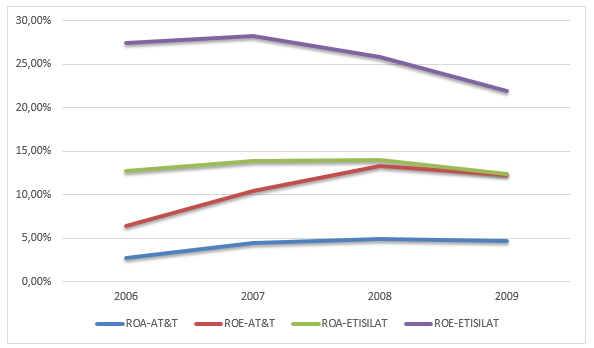
It can be seen that investors gain from profits more in Etisalat than in AT&T, although it is in downward trend.
In asset utilization AT&T appears to have a positive trend as all the ratios are improving from the year 2006 to the year 2009 while Etisalat is having the same trend although the ratios are not equal to each other but are almost of the same magnitude. The following chart shows the trend of receivable turnover fixed asset turn over and total asset turn over for the companies.
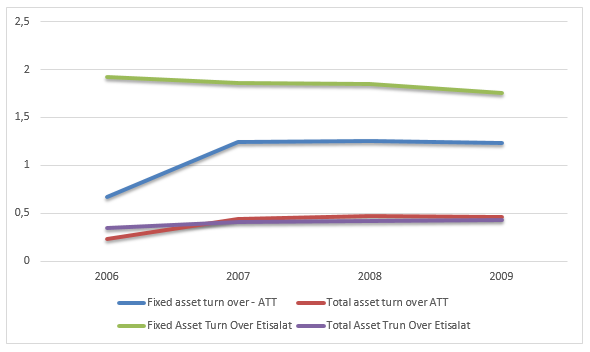
From the graph above the trend for AT&T appears to be uniform while the trend for Etisalat appears to be down ward trend for both fixed and total asset trun over.
The trend of liquidity for both companies is as shown below.
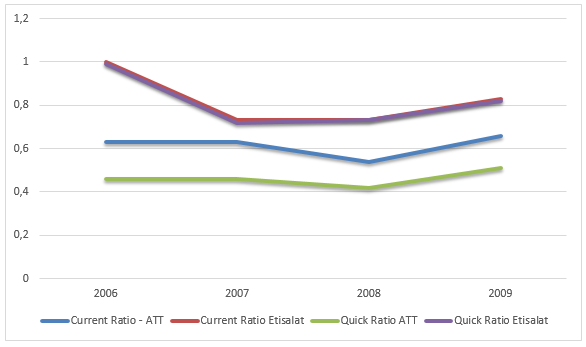
From the above grapph it appears that they have taken a similar trend in every aspect of liquidity.
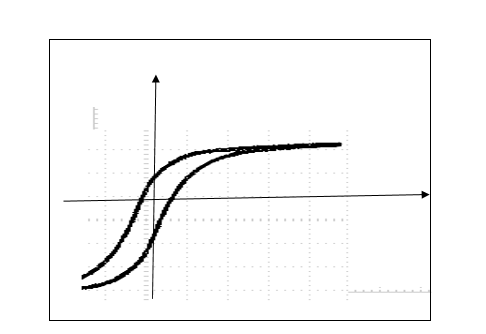
In terms of debt utilization it appears that both companies have a fairly similar trend except in times interest and where it is taking opposed direction of each other that is while AT&T is inupward trend Etisalat is in downward trend. The two chart below shows the trend of this ratios for the two companies.
When it comes to cash flow margin Etisalat appears to have a down ward trend while AT&T appears to have an upward trend. The trend graph below explain its all.
Conclusion
After analyzing the financial information of the organizations it can be reasonably concluded that the organizations are pursuing different objectives. The Etisalat appears to be making a good profit in the current era, however, there is no indication towards any new product development, and rather it appears that Etisalat is now focusing towards innovating its older products which is observable from the decreased in the research and development expense.
This trend does not appear to be favourable since in the coming years the prices of gas are expected to rise which will result in decreased sales. AT & T appears to be making a considerable amount of profit and from the profit statement it is apparent that the organization is focusing towards the development of new products which observable through the increased research and development expenditure. The organizations have satisfactory cash flows since most of its creditors have been paid off as is apparent from the cash flow statement, however has resulted in decreased liquidity for the both of them (Tracy, 2009).
Recommendation
An investor who is willing to invest in this industry should invest in Etisalat because it appears it performs well as opposed to the competitor AT&T. In terms of cash flow liquidity, and profitability, Etisalat is a good performer.
List of References
Blander, J., 1994. How To Use Financial Statements- A Guide to Understanding the Numbers. New York: McGraw-Hill Publisher.
Fridson, M., & Álvarez, F., 2002. Financial statement analysis: a practitioner’s guide. New York: John Wiley and Sons.
Fontes, A., 2005. Measuring convergence of National Accounting Standards with International Financial Reporting Standards. Accounting Forum , vol: 29 415-436.
ICFAI Center for Management Research ICMR., 2004. Financial Accounting & Financial Statement Analysis. Hyderabad: ICFAI Center for Management Research.
Ormiston, L., & Fraser, A., 2004. Understanding Financial Statements. New Jersey : Pearson-Prentice Hall.
Tracy, J., 2009. How to Read a Financial Report: Wringing Vital Signs Out of the Numbers. New York: John Wiley and Sons.