Introduction
The valley of Dyfi deserves credit for its past efforts in environment conservation, especially in energy production. Recently, the County Council of Powy received an award for the best rural partnership under the “campaign of take-off for renewable energy” by the European Union, for renewable energy projects. One such project is a 112 KW grid-connected hydroelectric unit, installed by a local farmer in the area (Wilson 2004, p.112).
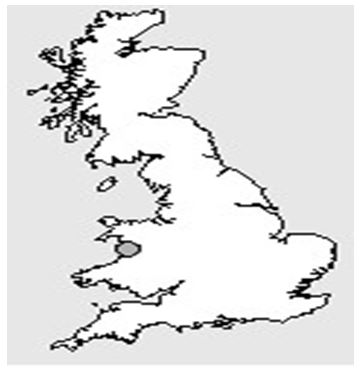
Emphasis on environment conservation has set a basis upon which future projects for power generation are proposed. This paper is a feasibility report on a possible hydropower plant that will be located at Nant y Darren a tributary stream of Afon Dulas, in Pantperhog, Machynlleth, and boarders Powys and Gwynedd counties. It is an analysis of all the features required and the available resources, for its full implementation.
Method
Assumptions
Site survey and research are the basis of this report. However, the values of efficiency have been estimated using standard projects of similar magnitude, to arrive at a production level of 250 kW.
Theoretical kilowatts = (Head * Flow)/ 11.81 and an efficiency of 60%. There will be losses because of the distance to the nearest grid, which is 134 meters. This contributes to a loss of 300 kW according to Guide to Hydropower (2010).
Another assumption is the costs of material for construction and is based on data available online, which is subject to change. The duration of the project depends on the immediate availability of funds and materials. Data on rainfall and water flow has been retrieved from the Centre of Ecology and Hydrology, which can be relied on. All the data is subject to errors since most has not been collected from the ground. This has been catered for by comparing information from different sources and the data used is the most consistent.
Analysis of the Data and Justification
Site Description
Nant Y Darren is a tributary of Dyfi River and will be the stream, where the project will be located. The site location will be 52º 37’ N and 3º 51’ W. The stream flows from Northwest towards Southeast. The site is rocky and impermeable, with 60% being grassland and 30% being covered by forest (Moore 2007). The head will be 9.45 from the turbine location, which will be 199m downstream (Wheaton-Green 2006). The other details of the location are listed in the table below.

Topographical analysis
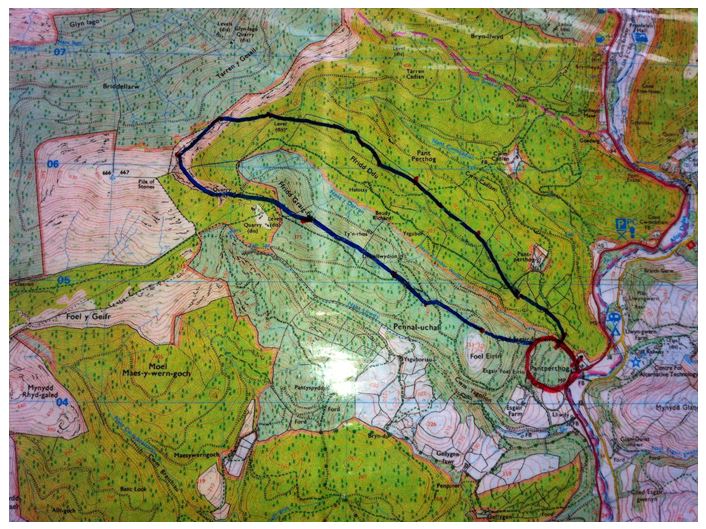
The region has a lot by vegetation on Boulder clay, Silurian formations, and alluvium deposits (Wilson 2004). It rises 1900 feet above sea level according to Wilson (2004). The catchment area around the location is three sq Km, and the nearest National Grid is 134 meters from the turbine location. Below is an illustration of area topography (Richard & George 2009).

Flow Analysis
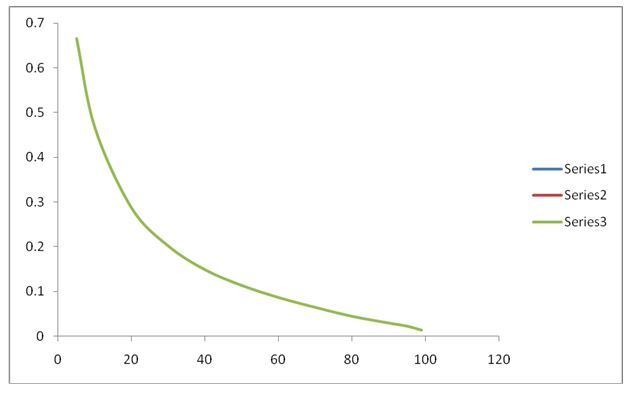
A flow survey was conducted by scaling down data obtained from nearby River Dyfi. The data was then modeled using OS Map Data to come up with data appropriate for design flow. The following flow data was obtained. The annual mean flow is 0.198 m3/s with a Q95 of 0.023 m3/s for a basin of 3.199 km2 (National Water Archive 2010).

Permissions
Planning permission for the project has already been granted and an abstracting license issued. The other body whose permission is required is the management board of the River Dyfi since it is the one in charge of Nant Y Darren. The impact of the project should have minimal, or no effects, on the flow rate, neither should it affect aquatic life (Godfrey 1996).
Results
Design
The location of the site can only allow for a run–of––river rather than an impoundment system, the other category. This is because the area has steep valleys, is largely forested. It cannot support a dam and the lack of a natural lake eliminates the possibility. This gives the design three possible arrangements: an open channel, a channel, and penstock, or one with a penstock alone. The most appropriate in this situation is one with a penstock only which will be fed by an intake point (weir) taking water to the powerhouse (Curtis and Langley 2004). Debris and dirt will be removed through the use of a Forebay structure that will screen dirt from water. Water will be directed to the turbine through the 199m long Penstock to the turbine located in the powerhouse. Then water will be directed back to the stream through a tailrace.
Turbines and Ancillary equipment
Hydraulic power required for the turbine is dependent on the head across of it and the flow passing through it. For higher output, the flow should be higher and the same case should apply for the head, which in this case is small according to Grigsby (2007). The advantage of using this head is that its sheer size prevents its loss during rainy seasons when flows are very high. Any loss of the head causes a loss in power output. A 50% loss contributes to a 65% power loss. This head, however, has a disadvantage. The head drives a larger turbine, which requires more power to rotate, thus there is power loss. To increase efficiency, the head should allow for more rotation power to the turbine by improving the water contact and removal of trash that might slow down the rotation of the turbine (Grigsby 2007).
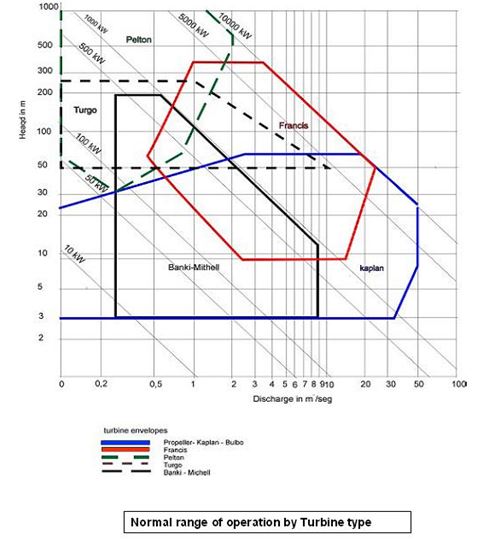
The turbine will be dependent on the flow. Basic propeller turbines make use of fixed rotor blades and guide vanes. These are used in areas where the flow is expected to be constant with small variations in seasons. Impulse turbines are used in areas where rotation is because of high-velocity jet, which is created by the pressure from the head. (Grigsby 2007, p. 178). The table below shows some turbine types with their head ranges.
The type of turbine to be used is significant, for it must satisfy three conditions namely: have a specific speed that is reliable, have maximum flow performance, and be cost-effective. The specific speed should meet the set standard of 1500 rpm, driving a 4-pole generator at a frequency of 50Hz. The specific speed is determined using the formula:
n= (Ns H5/4)/ P1/2
Where n is the speed in rpm, Ns is the specific speed, H is the head while P is power (Godfrey 1996).
The range of specific speed is 200-400. The higher the specific speed, the faster the turbine and the lower the costs in the shaft, gearboxes, and generator according to Grigsby (2007). This however has more friction losses. The part-flow performance determines whether the turbine will drain the river when the flow fails to meet the demands of the project. This requires regulation, whereby the inlet guide vanes and runner blades are adjusted, to reduce or increase the amount of flow they draw. These are more expensive. There should be enough potential available to rotate the turbines, to generate 10 Kw of power on average (Wilson2004).
The output of the turbine will be selected depending on the size of the pipe diameters. The diameters and outputs are listed below.
Using the data above, an optimization table was obtained for maximum annual energy output, which ranges between 50-70% in terms of Q should mean (Guide to Hydropower 2010).

From the analysis above the best turbine would be Francis with the pipe being 350-400mm in diameter. They are crossflow turbines (that have adjustable inlet vane) and open-flume Francis turbines that have adjustable guide vanes (Grigsby 2007, p. 178).
Cost analysis
The distribution of costs is listed in the table below.
The revenues are for 350mm and 400mm Penstock is £ 6500 and £ 7000 respectively. The payback for the 350 mm penstock will be twelve years and sixteen for the 400 mm. The cost per kW is £1554 per kW.
Assumptions and errors
- Size of pipe diameters were those available from suppliers
- The costs of materials and construction are based on previous projects of the same magnitude and are subject to change.
- Annual energy output is subject to changes in flows which differ season in season out.
- The revenues are subject to changes from inflation and oil prices.
- Different suppliers have different specifications for materials. This has not been accounted for.
Conclusions
Project Management
The project will be realized in three phases. The first phase is the excavation phase. The process of excavation involves clearing and construction of the diversion of the water flow. The plant is then designed in place in readiness for construction. The whole process takes a minimum of three months. It is during this phase that materials for construction are brought to the site.
The second phase is the major construction phase. The powerhouse and installation of intake pipeline, turbines, and generators are done. This will take five months. The last phase the completion phase takes three months. All wiring is done and the machines tested in readiness for production. The plant will be connected to the grid and tested.
Recommendations
The project is expected to interrupt the smooth flow of the river for eleven months of construction. The river is a habitat for salmons and brown trout, which will be adversely affected by the construction. The long-term effect of the plant is estimated to be a 21% loss of water for the river. This is a small percentage compared to the output of the plant. With a cost of £1554 per kW, the project is attractive. It is below the £2000/kW level for renewable energy production in the UK (Boyle 2004).
Irrespective of the negative effects on aquatic organisms, the project is viable and worth the funding. Its future benefits exceed the costs it will incur. The site is the fate for the project; the next step should be seeking for environmental permissions before seeking project financers.
References
Boyle, G. (2004), Renewable Energy: Power for a Sustainable Future, Oxford University Press, United Kingdom.
Curtis, D. & Langley, B. (2004), Going with the Flow: Small Scale Water Power, Centre for Alternative Technology Publications, United Kingdom.
Godfrey, B. (1996), Renewable Energy: Power for a Sustainable Future, Oxford Press United Kingdom.
Grigsby, L. (2007), Electric Power Generation, Transmission, and Distribution, CRC Press, New York.
Moore, R. (2007), The PDM Rainfall-Runoff Model. Hydro. Earth Syst. Sci, Vol. 11 No. 1 pp 482-497.
‘National Water Archive’(NWA), Centre for Ecology and Hydrology. Web.
‘Planning for Your Hydro System’, Guide to Hydropower. Web.
Richard, L. & George, F. (2009), Visualization for Coastal Hydro-informatic Modelling: Development of a Visualization Tool Using VTK to Analyse TELEMAC-2D Estuarine Data-sets, Using Test Data from the Dyfi Estuary, Wales, VDM Verlag Germany.
Wheaton-Green, K. (2006), Summary Table of Sites with Potential for Hydropower, Oxford Press, United Kingdom.
Wilson, E. (2004), Going with the Flow: Small Scale Water Power, Centre for Alternative Technology Publications, Wales.