Introduction
This report presents the financial performance analysis of Covidien PLC (COV) for Financial Years (FY) 2008-09. The analysis is carried out by employing top-down approach which presents economic and industry analysis before evaluating the financial ratios performance of the company.
The economy and industry analysis helps identify external factors which are beyond the influence of management but affect the performance of the company to a great extent.
Moreover, to provide a comprehensive analysis, Covidien’s financial performance is compared with Johnson and Johnson’s financial performance during the same years. The paper concludes by highlighting the weaknesses and providing recommendatory actions for Covidien so as to improve its financial performance.
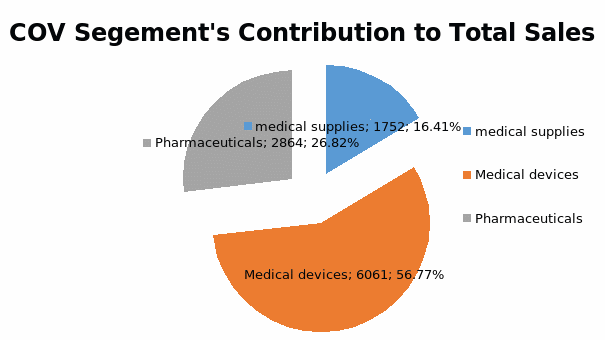
Covidien Plc is an Ireland-based company which operates in three segments namely, Medical devices, Pharmaceutical, and medical supplies. The $10.7b company has various industry-leading products and brands in its portfolio.
Currently, COV employs 42,000 people in more than 60 countries and enjoys its customer base in over 140 countries globally. Figure 1 shows the contribution of each segment to the total sales of the group (COV, A: 2009, p. 1).
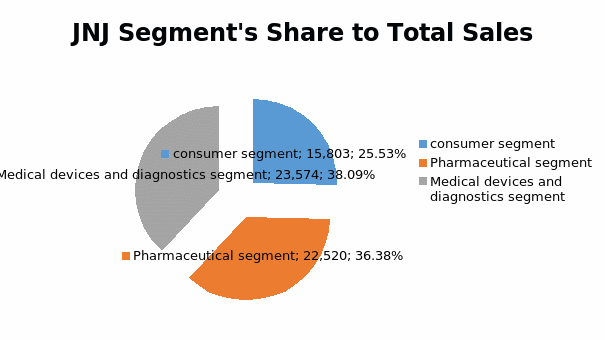
JNJ is engaged in R&D, manufacturing, marketing, and selling of various healthcare products. It is currently operating in three business segments; namely Consumer, Pharmaceutical, and Medical Devices, and Diagnostics. JNJ employs 114,000 people in over 250 companies operating in 60 countries globally (JNJ, A: 2009, p. 7). Figure 2 presents JNJ’s segments’ analysis.
Economic Analysis
Financial markets during 2009 exhibited exponentially rising pressure on businesses to de-leverage their operations. Despite the consistent and in-depth support of their respective governments to advanced economies, the pressure on financial markets did not subside.
It was because of this consistently rising stress that financial institutions had to support their balance sheets by employing asset sales and retiring of maturing loans (IMF, 2009). Consequently, credit availability for corporations from financial institutions reduced. The downward pressure was not experienced by financial institutions only but by the economies at global level.
Thus, businesses did not only have choking of financing alternatives, but the economic downturn resulted in increase in inflation, increase in unemployment; hence decrease in consumer spending. This decrease along with increased cost of doing business resulted in deteriorating revenues, profits, margins, turnovers, and returns for businesses in all the industry sectors.
The major US economic indicators during 2009 experienced serious setbacks, for instance,
- Real GDP declined by 4.9% and 0.7% during the first half of the year and it decreased annually by 2.5% in 2009 (Sam, et al., 2010).
- Moreover, its industrial sector growth declined by 2.8% and 6% in the last half of 2009 (Sam, et al., 2010).
- The unemployment rate rose to 9.3% during the same year (Sam, et al., 2010).
- Disposable personal income decreased by $25.7b and personal consumption expenditure decreased by 33.6b (Gilani, 2009).
- 10-year T bill rate 3.85% (Gilani, 2009)
- CPI rose by 1.7% (Gilani, 2009)
- S&P500 3 years returns as of November 2009 decreased by 7.9% (Standard and Poor’s, 2009)
All of the above and many other external and internal variables affected pharmaceutical industry as well. It was assumed at the beginning of recession, that pharmaceutical industry would remain safe from economic shocks however the reality showed a different picture.
It is because of very high fixed cost associated with the industry in the shape of heavy investment in machinery, research and development, and equipment, that the small players in the industry became suitable targets for acquisition. Thus, many large companies within the sector went on shopping sprees (Charles, 2009).
Not only this, many companies also got rid of their less profitable operations so as to improve their dying operational efficiency. Most importantly, many of them reduced their high financial leverage, primarily because reducing operating leverage or business risk was beyond their influence.
Thus, by reducing financial leverage, companies tried to cap the volatility of their returns for the investors. Many similar decisions were also taken by Covidien PLC so that it could remain headstrong in those tough trying times of economic recession.
Actions taken by COV due to changes in financial markets during economic recession in 2009:
- It reduced its net debt by more than $1.7b and increased its equity by $1.5b (Covidien, A: 2009, p. 2)
- It made considerable acquisitions so as to strength its brand portfolio; the two most significant ones are Bacchus Vascular and VNUS Medical Technologies, which are expected to provide $2b market in the coming years (Covidien, A:2009, p. 2).
- It did not only widen its brand portfolio, but it also eradicated less profitable brands and products from its portfolio. During FY 2009, COV divested its Sleep Therapy and Oxygen Therapy product lines and exited the Sharp Safety business in Europe (Covidien, A: 2009, p. 84).
- Moreover, the company adopted a share-repurchase program to improve the dying ROE of the company. It repurchased 6 million ordinary shares for $225m from the market (Covidien, A: 2009, p. 104). A more detailed analysis of Covidien’s management policies and strategies appears in the ratios analysis section of this report.
Current economic conditions and future expectations:
Economists predict that the global economy will catch its breath during FY2010. However slow recovery has been predicted for US economy, primarily because of decline in GDP growth rate and depressing growth rate and slow activity reports in housing and labor market during the first three quarters of FY10 (RBC, 2010). Nevertheless,
- GDP is predicted to be 3% annually during 2011 (Sam, et al., 2010)
- Consumer spending will increase by 2.7% in FY2011 (Sam, et al., 2010)
- Business investment will rise by 0.6%. They are concentrating higher investment in the shape of equipments and acquisitions. However, the pace of investment is minimal because businesses are still hesitant in engaging funds for very long (RBC, 2010)
- Business and labor productivity will rise by 2.1% (RBC, 2010)
- Core CPI will grow by 1.7% (RBC, 2010)
- But unfortunately, unemployment will remain a dire problem because it is expected to grow by 9.1% during FY2011 (RBC, 2010).
- From August through October 2010, S&P 500 index rose by11% and 9% growth rate is predicted during 2011 (Sam, et al., 2010)
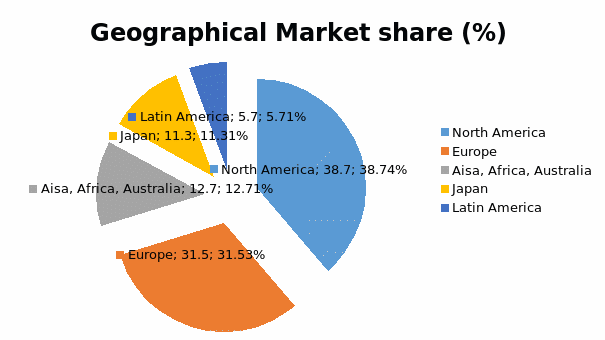
COV is operating in the Health Care sector, primarily within the sub-sector- Pharmaceutical. This sector has reported $ 300.3 billion US sales in FY2009. At the global level, $ 837 billion sales were recorded in FY2009, which is expected to reach $ 1.1 trillion by 2014 (Staflan, 2010).
Figure 3 shows the geographical market share in the global pharmaceutical industry with 38.7% market share of North America. However, it is predicted that Latin America, Asia, Africa, and Australia will have the highest (10-15%) growth rate in the sector during the next five years, whereas the US market will grow by only 3%.
The following are major observable characteristics and trends in the industry:
- Very tough competition from generic drug makers
- Unparalleled pricing competition from other players
- Extremely hard to control-rising R&D budgets
- Dearth of innovative products
- Alliance and acquisitions might make news
- Exponential growth of more health-conscious population around the world
- Rise of chronic diseases
- Ageing of population
- China, Brazil, Mexico, South Korea, Turkey, India, and Russia are predicted to grow annually at the rate of 14%–17% in the next five years.
Ratios Analysis
The section is broadly divided into five categories to help assess liquidity, long-term solvency, asset management, profitability, and market position of COV. For each category, a set of ratios are employed so as to analyze the major performance indicators of the company.
Liquidity Analysis
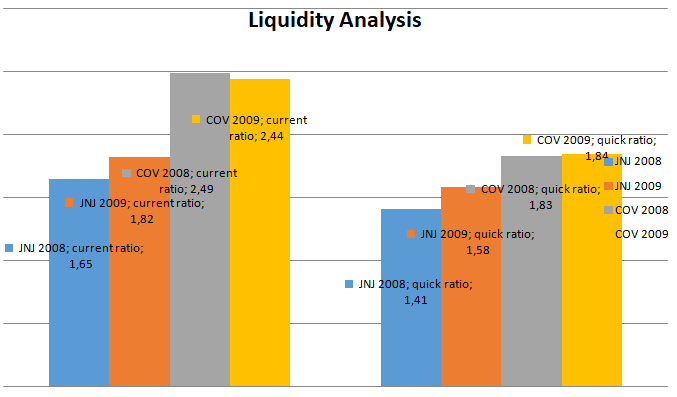
It helps assess the company’s ability to meet its short-term obligations (Ross et. al., 2007, p. 96). Current ratio and quick ratio are employed here to assess the liquidity position of both the companies.
Current ratio: It indicates the ability of a company’s current assets to retire short-term obligations (Ross et. al., 2007, p. 96). Current ratio for COV was 2.49 times in FY08 which decreased by 2.06% to become 2.44 times in FY09. This implies that COV has $2.49 of current assets to retire $1 of current liabilities.
The decrease is attributable to 9.54% increase in current liabilities which is more than the 7.66% increase in current assets. On the contrary, current ratio for JNJ was 1.64 times in FY08 which increased by 10.37% to become 1.81 times in FY09. The increase is attributable to 15% increase in current assets which is more than the 4.55% increase in current liabilities.
Quick ratio: It is a more conservative approach to assess the liquidity because it measures the ability of highly liquid assets only, to meet short-term obligations (Ross, et. al., 2007, p. 96). Quick ratio for COV was 1.83 times in FY08 which slightly increased by 0.54% to become 1.84 times in FY09.
The increase is attributable to 21.44% increase in cash and equivalents which is more than the 7.66% increase in current liabilities. On the contrary, current ratio for JNJ was 1.4 times in FY08 which increased by 12.43% to become 1.58 times in FY09. The increase is attributable to 46.82% and 77.12% increase in cash and marketable securities respectively which is more than the 4.55% increase in current liabilities.
Long-Term Solvency Position
It indicates the company’s ability to meet its long term obligations; in other words, it assesses the financial leverage of the company (Ross, et. al., 2007, p. 97). Debt/equity, debt/assets and times interest covered are employed here to assess the long term solvency.
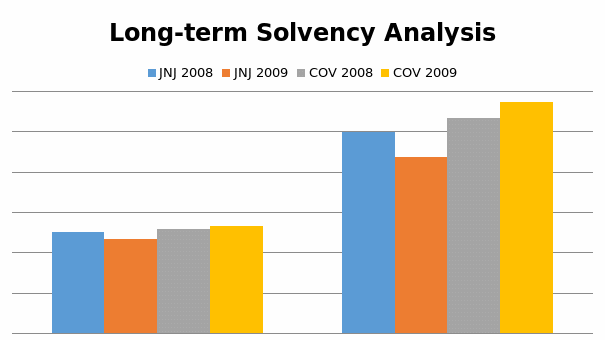
Debt/assets (D/A): It indicates the percentage of a company’s assets financed by debt (Ross, et. al., 2007, p. 97). For COV, D/A was 51.59% in FY08 which increased by 3.35% to become 53.32% in FY09. The increase can be attributed to 9.54% increase in total debt which is more than the 7% increase in total assets.
This 7% increase in total assets was driven by 7.01% increase in non-current assets which form 68% of total assets held by COV. On the contrary, D/A for JNJ was 49.94% in FY08 which decreased by 6.74% to become 46.57% in FY09. The decrease is attributable to 11.51% increase in total assets which is more than the 3.99% increase in total debt.
Debt/Equity (D/E): It assesses the capital structure of a company by indicating the percentage of debt and equity financing available with the company (Ross, et. al., 2007, p. 98). The higher the debt, the higher is the financial risk carried by the company. For COV, D/E was 106.57% in FY08 which increased by 7.7% to become 114.21% in FY09.
The increase can be attributed to 9.54% increase in total debt which is more than the 3.28% increase in total equity. A 7.7% increase in total debt was driven by 20.84% increase in non-current liabilities which form 75.9% of total debt held by the company.
On the contrary, D/E for JNJ was 99.74% in FY08 which decreased by 12.61% to become 87.16% in FY09. The decrease is attributable to 19% increase in total equity which is more than the 3.99% increase in total debt.
Times Interest Covered (TIC)
It indicates the ability of a company’s EBIT to cover interest expense; the greater it is, the better (Ross, et. al., 2007, p. 98). For COV, TIC was 9.57 times in FY08, which increased by 10.77% to become 10.60 times in FY09. The increase can be attributed to a 7.25% and 16.27% decrease in operating profit and interest expense respectively.
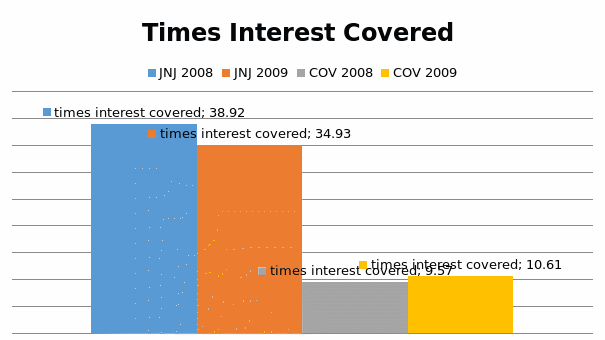
The 7.25% decrease in operating profit occurred because of 13.74% increase in operating expenses when revenue increased by only 3.4% in FY09. On the contrary for JNJ, TIC was 38.91 times in FY08, which decreased by 10.24% to become 34.93 times in FY09. The decrease is attributable to 6.93% decrease in operating profit along with 3.68% increase in interest expense.
Assets Management Analysis
It measures the management’s performance in utilizing its assets as efficiently and effectively as possible to generate higher turnovers (Ross, et. al., 2007, p. 100). Total Assets Turnover, Average Collection Period, and Inventory Turnover in days are employed here to assess COV’s assets management.
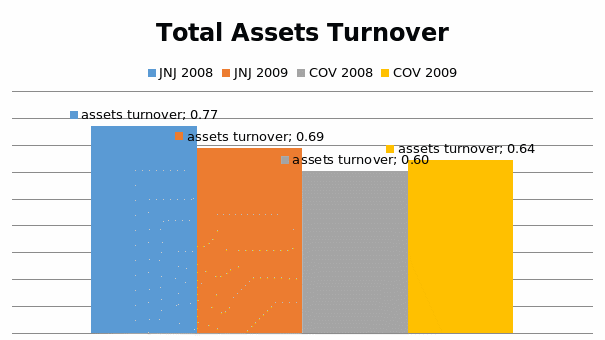
Total Assets Turnover (TATO): It indicates the management’s ability to utilize total assets of the company so as to generate greater revenue (Ross, et. al., 2007, p. 100). TATO for COV was 0.603 times in FY08 which increased by 6.78% to become 0.644 times in FY09.
The increase can be attributed to 3.8% increase in revenue which is less than the 3.46% decrease in average total assets. On the contrary, for JNJ, TATO was 0.76 times in FY08 which decreased by 10.3% to become 0.689 times in FY09. The decrease is attributable to 2.9% decrease in revenue along with 8.28% increase in average total assets.
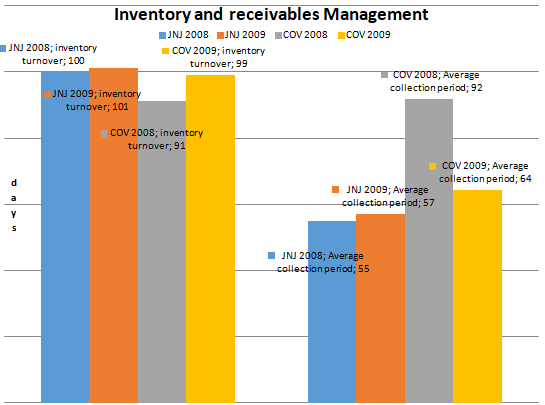
Average Collection Period (ACP): It indicates the number of days it takes for the company to receive cash from its customers on credit sales (Brigham & Houston, 2007, p. 92). ACP for COV was 92 days in FY08 which decreased by 30% to become 64 days in FY09.
The decrease can be attributed to 3.8% increase in revenue which is less than the 27.85% decrease in average receivables. On the contrary For JNJ, ACP was 55 days in FY08 which increased by 4.07% to become 57 days in FY09. The increase is attributable to 2.9% decrease in revenue along with 1.05% increase in average receivables.
Inventory Turnover in Days (ITO)
It indicates the number of days it takes for the inventory to get restocked (Brigham & Houston, 2007, p. 91). ITO for COV was 91 days in FY08 which increased by 8.52% to become 99 days in FY09. The increase can be attributed to a 0.1% decrease in cost of revenue along with an 8.4% increase in average inventories.
On the contrary For JNJ, ITO was 100 days in FY08 which slightly increased by 1.04% to become 101 days in FY09. The increase is attributable to a 0.35% decrease in cost of revenue along with a 0.69% increase in average inventories.
Profitability Analysis
It assesses the company’s ability to withstand falling revenue or increasing costs and expenses; the greater the profitability, the better (Hampton, 2003, p. 110). Gross, profit margin, operating profit margin, net profit margin, return on assets, and return on equity are employed to assess the profitability.
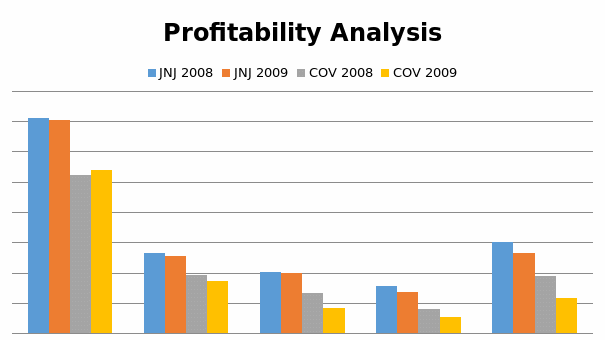
Gross Profit Margin (GPM): It shows the profits after covering the direct cost of revenue; the higher it is, the better (Hampton, 2003, p. 110). GPM for COV was 52.8% in FY08, which increased by 2.82% to become 53.75% in FY09.
The increase is attributable to 5.98% increase in gross profit which is greater than the 3.08% increase in revenue during FY09. However, JNJ showed a better performance by exhibiting GPM of 70.96% in FY08, which slightly decreased by 1.08% to become 70.28% in FY09. The slight decrease is attributable to 3.95% decrease in gross profit when its revenue decreased by 2.9%.
Operating Profit Margin (OPM): It indicates the operational efficiency of a company; the higher the margin, the greater is the operational efficiency (Hampton, 2003, p. 110). , OPM for COV was 19.32% which decreased by 10.02% to become 17.38% in FY09.
The decrease can be attributed to 7.25% decrease in operating profit which is more than the 3.08% increase in revenue. On the other hand for JNJ, OPM was 26.56% in FY08, which decreased by 4.15% to become 25.45% in FY09. The undesirable decrease is attributable to 6.93 and 2.9% decrease in operating profit and revenue respectively.
Net Profit Margin (NPM): It indicates the percentage of revenue which finds it way to become net profit; the greater it is, the better (Hampton, 2003, p. 110). NPM for COV was 13.14% which decreased by 35.5% to become 8.49% in FY09.
The decrease can be attributed to 33.6% decrease in net profit which is more than the 3.08% increase in revenue. On the other hand for JNJ, NPM was 20.3% in FY08, which decreased by 2.4% to become 19.8% in FY09. The undesirable decrease is attributable to 5.27% and 2.9% decrease in net profit and revenue respectively
Return on Assets (ROA): It indicates the return on each $ invested in assets of a company (Brigham & Houston, 2007, p. 101). ROA for COV was 7.93% in FY08 which decreased by 30.97% to become 5.47% in FY09.
The decrease can be attributed to 33.36% decrease in net income which is more than 3.46% decrease in average total assets. On the contrary for JNJ, ROA was 15.61%in FY08 which decreased by 12.5% to become 13.66% in FY09. The decrease is attributable to 5.27% decrease in net income along with 8.28% increase in average total assets.
Return on Equity (ROE): It indicates the return on each $ invested by the equity shareholders of a company (Brigham & Houston, 2007, p. 101). ROE for COV was 18.79% in FY08 which decreased by 38.69% to become 11.52% in FY09.
The decrease can be attributed to 33.36% decrease in net income along with 8.69% increase in average equity. On the contrary, for JNJ, ROE was 30.17%in FY08 which decreased by 12.67% to become 26.35% in FY09. The decrease is attributable to 5.27% decrease in net income along with 8.47% increase in average equity.
Investment Ratio Analysis
It indicates the attractiveness of a company’s shares in the secondary market, based upon the past financial performance and future expectations of a company’s performance (Brigham & Houston, 2007, p. 102).
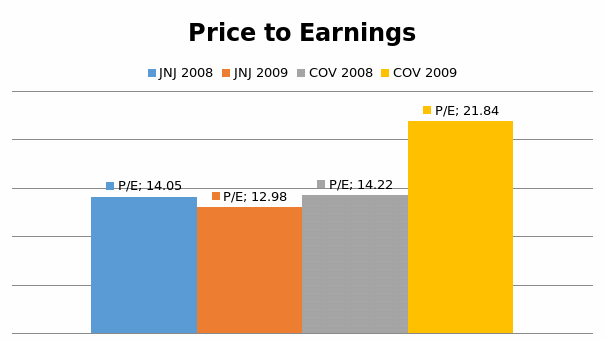
P/E analysis: it indicates how much investors are willing to pay as the share price, for each $ of reported profit (Brigham & Houston, 2007, p. 102). P/E for COV was $14.22 in FY08 which increased by 53.56% to become $21.84. The increase is attributable to 10.46% decrease in average market price of its stock, which is less than the 42% decrease in EPS.
On the other hand, P/E for JNJ was $14.04 in FY08 which decreased by 7.6% to become $12.98. The decrease is attributable to 10.98% decrease in average market price of its stock, which is more than the 3.68% decrease in EPS.
Dividend Payout (DPO)
It shows the percentage of net income being paid out as dividends to shareholders (Brigham & Houston, 2007, p. 103). COV had a DPO of 20.85% in FY08 which increased by 76.87% to become 38.87% in FY09.
This increase is attributable to 3.13% increase in dividends per share whereas EPS decreased by 41.6%. JNJ, on the contrary, had DPO of 38.96% in FY08, which increased by 11% in FY09 to become 43.37%. The increase is attributable to 7.22% increase in dividends per share along with 3.68% decrease in EPS.
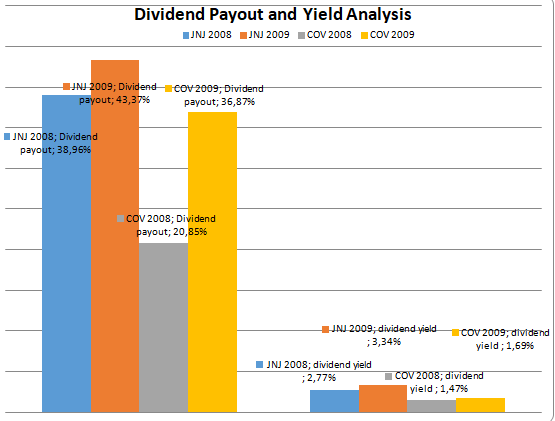
Dividend yield (DY): It measures the return to shareholders from cash dividends only (Helfert, 2008, p. 122). For COV, DY was 1.465% in FY08 which increased by 15.18% to become 1.6% in FY09.
The increase is attributable to 10.46% decrease in average market price along with 3.13% increase in dividends per share. JNJ’s DY was 2.7% in FY08, which improved by 20.45% to become 3.3% in FY09. The increase can be attributed to 7.22% increase in dividends per share whereas its average market price declined by 10.98%.
Concluding Commentary and Recommendations
The comparative analysis of liquidity seemingly proves COV as having better liquidity than JNJ as represented by a higher current ratio. However, a more realistic picture of COV’s liquidity is presented by its quick ratio which is quite lower than the current ratio.
This implies that COV has been having a higher but unproductive liquidity because it engages its funds in the shape of higher inventories which are the least liquid assets.
JNJ on the other hand, shows lesser liquidity but with greater productivity, which is primarily driven by prudent strategy of investing in marketable securities during economic recession, so that their liquidity does not deteriorate. Thus, it is advisable that COV should maintain a productive level of liquidity; otherwise, it will signal to investors that its management is incapable of efficient utilization of the resources available.
With respect to long-term solvency, COV is carrying higher financial risk by having a higher D/E. This increase in leverage can be a favorable factor in good economic situations because it helps increase ROE.
However in unfavorable economic conditions like that in 2008-09, higher financial leverage would translate into increased burden on the operating profits to cover interest expense. With declining revenue and profits, higher interest expense results in lowering of net profit. The worrisome issue for COV is not only that it is more leveraged than JNJ, but it also is unable to cover its interest expense as much as JNJ can.
Hence, it is advisable for COV to reduce its debt reliance, because pharmaceutical industry already has high operating leverage and if financial leverage will also be high, investors would require very high risk premium to safeguard themselves against the company-specific risk. This in turn would increase the cost of capital for the company which might become difficult for COV to meet, particularly during poor economic conditions.
With respect to asset management, I believe that COV has been performing well. However, it has to revise its credit policy so that it can have a moderate policy which will not drive its customers away to competitors but at the same time, it does not keep funds engaged for longer in the shape of receivables.
With respect to profitability, COV has an immense room for improvement particularly when compared with JNJ’s profitability. Hence, it is advisable that COV should penetrate more into the market by introducing newer products, and by entering newer geographical regions, particularly in emerging markets.
Moreover, it also should implement cost and expense control measures, so that its cost does not rise with the same percentage as that of its revenue. Although, COV’s management has made successful and beneficial additions to their brand portfolio during FY09, but real benefit from these additions in the shape of high revenue, can only be reaped if it will able to increase its operational efficiency as well.
Finally, an intelligent move by the company’s management was to increase its dividend payout, which despite the declining profitability, helped to increase its P/E.
In other words, COV was able to keep investors’ confidence intact during economic recession by providing higher dividends per share despite decrease in net profit. Hence, I believe that with positive economic prospects, COV will surely perform better in future; hence it is a worthwhile investment to make.
References
Brigham, E., & Houston, J. 2007. Fundamentals of Financial Management. 10th ed. Ohio: Cengage
Charles, S. 2009. Effects on the Pharmaceutical Industry During 2009 Recession. Web.
Covidien, A: 2009. Covidien Plc Annual Report. Web.
Gilani, S. 2009. Outlook 2009: For The US Economy in the New Year, Pain Will Precede the Promise. Web.
Hampton, J. 2007. Financial Decision Making. 6th ed. New Delhi: Prentice Hall
Helfert, E. 2008. Financial Analysis Tools and Techniques. 4th ed. New York: McGraw Hill
IMF. 2009. Global Financial Stability Report- Market Update. Web.
JNJ, A: 2009. 2009. Johnson & Johnson Plc Annual Report. Web.
RBC. 2010. Economic and Financial Market Outlook. Web.
Ross, S. Westerfield, R. & Jordon, B. 2007. Fundamentals of Corporate Finance. 7th ed. New York: McGraw Hill.
Sam, et al. 2010. Industry survey- Trends and Projections. Standard & Poor’s Equity Research Report. New York: Standard & Poor’s.
Staflan, H. 2010. Industry Surveys: Health care- Pharmaceuticals. Standard & Poor’s Equity Research Report. New York: Standard & Poor’s.
Standard and Poor’s. 2009. Standard and Poor’s Reports Index returns- Press release. Web.