Executive summary
In this section, the report will analyze the paper at it is from the first section to the recommendations to the investor. First, the fundamental analysis is important to help investors understand the factors to consider before investing. These can be the existence of the company, what it does, and who they are (Sugar, 2017). The other important aspect in their historical information, for example, for how long have they been in existence? Who are the CEO, and top officials? Where is the company located? When one knows that, then the next step is to know their growth history. How much money do they make per year? Has the price been increasing or decreasing over the years? If the price has been on a downtrend, the investor can consider buying but this can only be applied under certain circumstances. For example, the company giving investors hope that the price will increase.
This report has analyzed IBM Company which is a giant tech company that has been in existence for years. Financial reports of the company are analyzed to give investors an insight into the company’s performance. From the analysis, it is concluded that the company has been on a downtrend for years since 2013 (Vaughan, 2020). However, the company management has deployed infrastructures such as a hybrid cloud system, and change of business models to maximize revenue income. Since 2020 when the system was launched, the company has experienced high revenues. In the recommendation, the investor is advised to get ready to buy because this is the right time to get great ROI.
Company requirements analysis
This section will determine the basic requirement needed to invest in a particular company. The section will also analyze the key requirement any investor needs to look at before investing. The fundamental idea here is to help investors identify buy and sell signals through fundamental analysis, and the use of the stock screen to identify stocks to buy and sell. Before an investor determines the right time to invest, he or she needs to know the background of the organization. Several of the losses investors make are as a result of not knowing when to sell a stock before buying. Another key issue in loss-making is owning stock when the formed decision to buy fluctuate. In this section, we are going to look at two issues, the first being fundamental analysis, and the other technical analysis. The latter is usually more about moving average and related technical analysis on a chart.
Before investing, normally investors do fundamental analysis, which is usually based on the premises in which the price of the stock is at the moment. With some knowledge in fundamental analysis, one can determine which stock to buy based on the difference between their evaluations of the stock value, and the market value (Sugar, 2017). Such investors have a long-term deal and a limited number of transactions which means a long time will reach the evaluation investor had. The fundamental approach is based on the academic notion that the net present value of all future dividends is the price of a stock. This value, also known as intrinsic value, is calculated by the investor using the company’s fundamentals, which include factors like sales, growth rate, management, industry, and potentials.
The fundamental analysis focuses on the entire economy and the condition of the industries associated with it together with the financial condition and management of companies. To perfect this, the investor should know the yearly revenues, and the future growth for the company they are interested in. All these values are important in underlying value and determining the future growth of the organization. The paper will discuss in advance some of them later. The fundamental analysis is two things, value, and growth. The value is where the investors identify the undervalued stock and invest in them. On growth, the investors find the company with the potential to grow above the existing companies. Value investing is the most liked form of stock investment by many investors. It is a very disciplined way of investing to identify companies that sell below the standard value, are well managed, and have great products.
There are several factors investors need to evaluate before investing in any company. One of them being the size. The size of the company is usually measured by the number of employees. So, the higher the number of employees the higher the company attracts investors. The stage of growth is another factor investors consider. If the company’s financial report shows tremendous growth in terms of income, then several investors will come on board. The other factor is the company’s worth, it is true some companies might have several employees, but the worth is below the standard. The company’s worth helps investors determine the amount to invest. And finally is the management of the company. Some companies are not well managed hence losing potential investors. Management acts as a security to the investors.
Introduction
This report will help investors make a wise decision on matters related to stock trading, and investment. The report will give a summarized analysis and recommendation after a comprehensive analysis of factors any investor needs to consider before making any investment decision. Analyzing the fundamental analysis is like researching the health of a person. There are several factors that investors consider here; for example, projected EPS (Earning per share), company growth ratio, return on equity, and cash flow growth. The report will give enormous information about a company which helps investors make a wise decision. The investors will have information on the company’s revenue, cash flow, moving average charts, and the company’s growth ratio (Chougale, 2019). Also, the report will help investors know the amount to invest. For example, if the company’s worth is high, the investors will invest more. If the investment is way too below, the investor might not be interested in investing.
The report will analyze one company which will give investors time to decide if it’s the best to invest in or not. However, the investment decision should come up when all details are known and well understood. In this case, the report will do fundamental and technical analysis on IBM Inc. The report will include charts, tables, reports by authors, and statistical figures to give investors a comprehensive report. Technical analysis, which was mentioned in a previous section of the paper, is used in this phase. In technical analysis, future performance may be predicted through statistical analysis of stock and market performance in the past (Bruskin, 2017). That is, the price of a stock is determined by the actions of investors. Investors need comprehensive reports which show historical, and current data for comparison, and good decision making. For example, one can easily understand the growth of a company when they are shows the historical and current data.
Company Analysis
Fundamental analysis
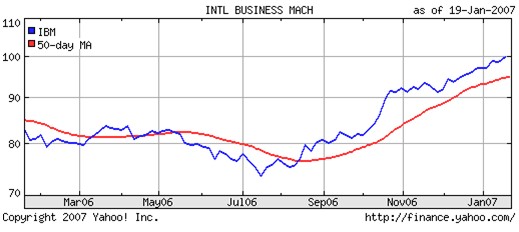
This part will discuss the fundamental and technical analysis of IBM Inc. The specificity of the analysis will give the investor a glimpse of the fundamental details of the company. With these details, the investors can decide whether to invest in the company or not. The technical analysis is whereby the future performance of the company can be studied based on the statistical analysis of historical performance. In most cases, the stock price is influenced by the behavior of the investors. For example, if investors behave similarly, the specific stock is expected to respond to such behavior (Bruskin,2017). When talking of technical analysis, it means analyzing the charts. Charts can be analyzed based on their historical performance.

The above chart shows the price hit on the month of October seem to reflect the same recorded on the same month 2019. That shows a tremendous growth in stock. On March 2020, the price was the lowest followed by a downfall in October 2020. The consistent increase in growth is noticed from that month of October 2020 to the same 2021. That shows the potential of growth from the company.

Technical analysis
Comparing this with 2019, there is a noticeable surge in stock value. As shown, the chart shows 50-day Moving Average. There are two important technical analysis methods; Moving Average, and stochastic method that compares closing stock price and price range over a specified period of time (Chougale, 2019). These two technical analysis methods are important for chartists. Some indicators help predict the future price movement, while others help find trends.
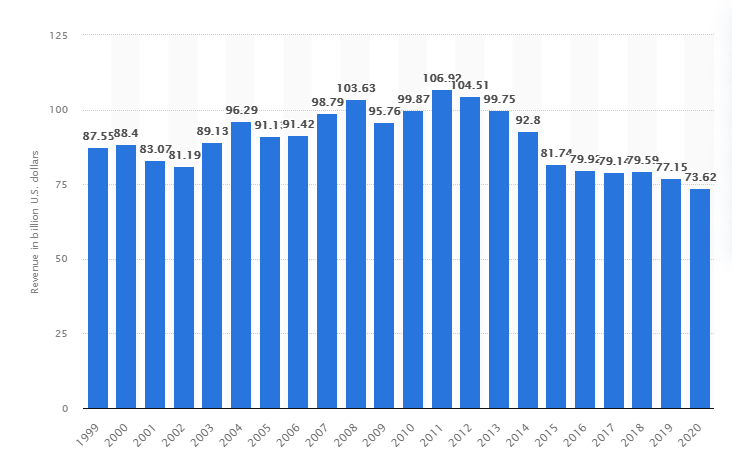
In terms of revenue, IBM recorded $73.6 billion in 2020 excluding the impact of currency and divestitures. However, the urgency on digital transformation specifically on hybrid cloud technology and AI will accelerate the growth (Coyne, 2018). In their annual report, IBM indicates that their cloud-related revenue grew to $25.1 billion which corresponds to a 20 percent increase. Global Business Service (GBS) cloud revenue doubled in profit. According to the executive, this was possible due to their focus on modernizing clients’ applications.

IBM’s revenue reached more than 73 billion dollars in 2020, maintaining an eight-year trend of declining revenues that began in 2011 when the company’s revenue rose to $106.9 billion. Despite dwindling revenues in the past years, this giant tech company remains one of the world’s most valuable technology brands, trailing just Apple, Google, Amazon, and Microsoft. This tech giant has been faced with struggles of change since the 1990s. IBM has recently emphasized a “strategic imperative” aimed at eliminating low-margin companies and focusing on high-margin ones. This strategy has helped IBM achieve advances; for example, in 2018, IBM sold WebSphere Commerce to HCL Technologies for $1.8 billion. However, despite its decline for a couple of years now, IBM is still profitable. The company’s digital transformation has sphere headed them into making huge revenue in 2020. The organization launched a platform that helps organizations integrate their traditional system into a multicolor environment.

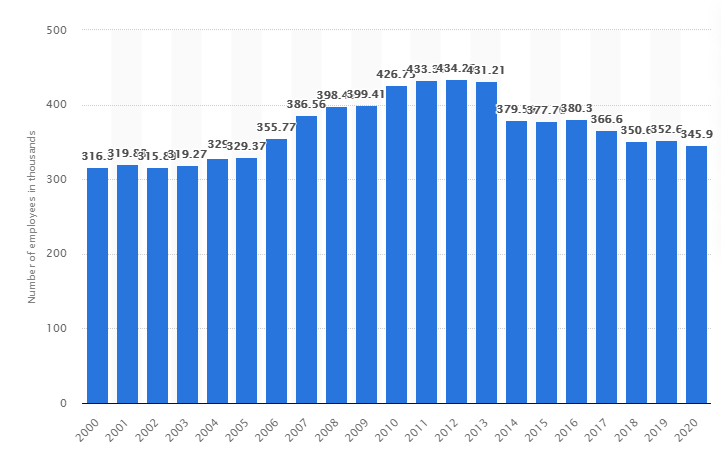
The chart above shows the number of employees IBM has employed each year from 2000 to 2020. Since 2013, there has been a decrease in the number of employees in the company. This can be related to its decline in revenue and redesigning of its business model. The tech business has been infamous for having a turnover rate of 13% when it comes to competent personnel that the organization wants to keep. IBM recently improved its artificial intelligence (AI) effort focused on the retaining skilled workers and obtained a patent for a “predictive attrition program” that predicts employee leaving and prescribes intervening steps (Gliozzo, 2017). IBM’s artificial intelligence program Watson has been a key source of its research and development. Therefore, despite its decline in revenue, IBM can regain its 2013 momentum especially with the launch of hybrid cloud and AI systems.

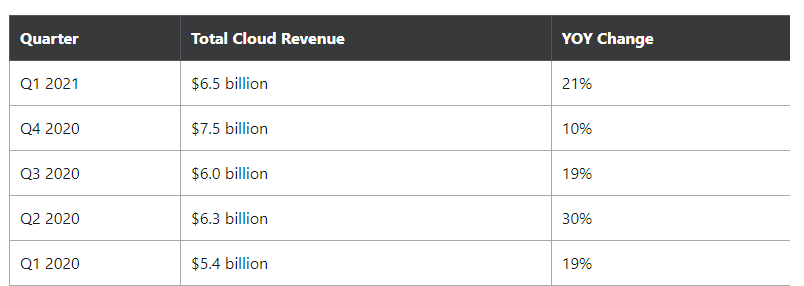
The first-quarter sales growth for IBM in 2021 was 1% year over year, the first since the end of 2019. The company’s cloud computing companies were a big help, accounting for $6.5 billion of the $17.7 billion in revenue in the quarter (Gliozzo, 2017). The company’s trend of the double-digit year-over-year increase in cloud revenue continued in the first quarter.
Conclusion
IBM is amid a turnaround after years of revenue decline. The tech giant is shifting its gears to cloud computing and artificial intelligence (AI). After the company’s first-quarter earnings release, IBM stock raised 52 weeks high this year in April. Based on the amount of revenue indicated by IBM on their hybrid cloud solution, first, it shows their cloud strategy is working, second, it shows the possibility of an increase in revenue over the years. The hybrid solution will be a game-changer at IBM because of its data privacy and cost-saving factors (Coyne, 2018). Again, this solution applies to all industries, from healthcare to finance. These factors could see a projected increase of 360 billion dollars by 2022. According to Executive Chairman Arvind Krishna, the company is positioned to lead as they enter into hybrid cloud and AI solutions. Based on the chart above, the company has been experiencing a tremendous decline in revenue for years. And normally what happens in technical analysis, if one notices a downtrend the trader prepares to buy.
Recommendation
Based on the above conclusion, the investors should prepare to buy because the company has shown that they are capable of making higher revenue. Based on their report for the year 2020 when the company launched the hybrid cloud solutions, the company’s revenue has been increasing. Again, their focus on data privacy, diversity in industries, and cost-effectiveness are what will attract several clients. To turn revenues around, the tech giant restructured the company by getting rid of mature and slow technology and replacing them with an emerging high growth hybrid multi-cloud market (Coyne, 2018). With these enticing changes, IBM’s Return on Investment is 5.64%. The economic profit, which is calculated as return on an investment minus weighted average cost of capital -0.18%. Why an investor needs to know about (WACC) is because it helps one understand how the company manages capital to deliver superior returns to its holders.
SHORTS
The investor should focus on buying considering the quantitative deceleration of the company revenue. The best is expected behind the signs of deceleration. The valuation is steep premium which means multiple contractions will kill the stock. There is quantitative evidence of deceleration meaning the revenue will increase. Some sentiment for an investor is positive, almost all buy ratings are on for anyone to see. IBM’s weekly chart forms a lid over stock showing a possible surge in price. The IBM management is promotional, so one can be assured the company assets are secure, and so the stock.
Reference
Sugar, N. C. D. E. X., Sugar, I. C. E., Months, M. M. M. M., Range, B. P., Outlook, P., & Upward, D. U. (2017). Fundamental analysis.
Vaughan, T. S. (2020). IBM Credit Revisited. The Journal of Applied Business and Economics, 22(6), 40-46.
Coyne, L., Dain, J., Forestier, E., Guaitani, P., Haas, R., Maestas, C. D.,… & Vollmar, C. (2018). IBM private, public, and hybrid cloud storage solutions. IBM Redbooks.
Bruskin, S. N., Brezhneva, A. N., Dyakonova, L. P., Kitova, O. V., Savinova, V. M., Danko, T. P., & Sekerin, V. D. (2017). Business performance management models based on the digital corporation’s paradigm.
Gliozzo, A., Ackerson, C., Bhattacharya, R., Goering, A., Jumba, A., Kim, S. Y.,… & Ribas, M. (2017). Building Cognitive Applications with IBM Watson Services: Volume 1 Getting Started. IBM Redbooks.
Chougale, M. K. H. (2019). A Study on Moving Average of Selected Stocks in Banking Sector using Technical Analysis. Management.