Executive Summary
The purpose of this project is to describe the business strategies of Nestle Group, which is one of the largest food processing companies in the world. This report includes the industry and company analysis, internal strengths, weaknesses, external opportunities, and threats factors; in addition, it assesses the corporate strategy of Nestle and Unilever using the financial statement of both companies for the last 5 years and compares strategic position by estimating different ratios, such as, return on total assets, return on equity, and profit margin. Furthermore, it focuses on national and global market analysis, marketing objectives, financial goals, target markets, key strategies of this company, and competitive advantage; finally, this project illustrates business-level strategy considering chocolate products of Nestlé Group and provides an implementation plan, considers market competition and gives recommendations for the future growth.
Introduction
The greatest and most diversified food and beverages corporation Nestle Group was established in 1905 after the merger of Anglo-Swiss Milk Company and Farine Lactée Henri Nestlé; both companies were founded in 1866; however, the business of this company had expanded rapidly from the First World War and its annual sales volume was 89.8 billion in 2017. At present, it has about 413 factories in 85 countries, which engage to manufacture more than 10,000 different products; however, it sells over a billion products each day and it invests approximately CHF 1.50 Billion in R&D every year to identify the trends of the consumer and develop the quality of the food items and ensure safety. This company expended CHF 17bn for salaries and social welfare, created 41,867 job opportunities, and trained 431000 farmers (Nestle, Annual Report 2016 6).
National, Regional, or Global Market Analysis
Nestle is a Switzerland based global FMCG that generates US$ 90,832 millions of net profit from its worldwide operation while it earns US$ 28.48 billion from the US market gaining 55.5% market share of that region, it also attained 19.1% of the market share of the European, Middle Eastern and Saharan market (Statistics & Facts). Fig.1 illustrates a better approach to Nestlé’s Global Market Analysis-
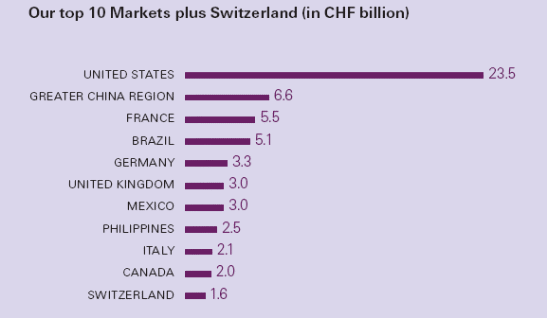
Nestle Group is not operating business within the borders of a specific region; however, it is a global market leader in the food manufacturing industry, which touches billions of people each day (Nestle, Annual Report 2014 3). This company earned CHF 39.4 billion from the US market, CHF 25.9 billion from the European zone, CHF 26.3 billion from Asian and African Countries; however, it has to consider different marketing strategies to promote individual brands in different countries (Nestle, Annual Report 2014 3).
Industry Analysis
The global food processing industry has been going through the challenge of increasing demand for organic foods, short shelf life, rising packaging cost, and growing health awareness as well as intense competition among the players where Nestle is a market leader. In comparison to other industries, the global financial crisis has less impact on the food processing industry; however, growing awareness that processed food causes allergens, and obesity, while organic food reduces health risk, will increase the market share of organic food processors that undoubtedly affect Nestle and other players to the core business.
Being the market leader of the food processing industry, Nestlé’s revenue is growing and captured 42 percent of the US food and beverage market share
(Nestle, Annual Report 2014 23). Quick technological integration and innovation are major driving forces of the food processing industry and to respond to this industry trend, Nestle has been increasing its investment for research and development and has allocated 2 billion dollars for cooling dehydrating, and freeze and it has provided a competitive advantage for the company.
Company Analysis
Nestlé the undisputed market leader of the food processing industry has aimed to respond to the changing dynamics of the customer’s trend and focused more than ever upon health and nutrition, new product generation along with a new health science subsidiary that may connect with pharmaceutical for everyday life. Table 1 shows key products of Nestle-
Table 1. Product portfolio. (Nestle, Annual Report 2014 34).
The income statement of Nestle demonstrates that the net profit of this company is at a satisfactory level, such as, net profit was CHF 144.56 billion, CHF 90.6 billion, and CHF 85.31 billion, in 2014, 2015, and 2016 consecutively (Nestle, Annual Report 2016 88); however, the financial ratios of this food manufacturing company has been analyzed later on this report. The current ratio of Nestle has been dropping slowly; whilst in 2016 and 2015, the ratio was less than one; which indicates that it has the potential risk of bankruptcy in the recent year higher liabilities; furthermore, the quick ratio was much lower and the debt-to-worth ratio was comparatively higher than expectation. Table 2 shows the key ratio of Nestle Group –
Table 2. The key ratio of Nestle Group. Source: (Nestle, Annual Report 2014 5), (Nestle, Annual Report 2016 47).
Customer Analysis
According to the annual report (2014), 28% of sales revenue generated from Europe, 43% from the Americas, and 29% from Asia, Oceania, and Africa; however, the customers of the United States highly rely on this brand while more than 23% sales revenue gathered from this market; however, the following table gives more information related with customer analysis.
Table 3. Customer analysis. Source: Self-generated.
SWOT Analysis of Nestle Group
Strengths
- Brand awareness: Being one of the largest food company in the world, Nestle group has the strong brand image in the global market;
- Product line: It has over 8000 individual products under its name, which contribute to maximizing profit margin;
- Business expansion: Nestle Group is one of the fastest-growing company in the global food processing market;
- Joint venture: It has already expanded the business by applying joint venture strategy and experienced success in the cereal and beverage industry;
- Distribution channels: Nestle Group has a wide distribution channel to carry on business both in urban and rural areas;
- Human resources: According to the annual report 2016, it has more than 335000 employees all over the world; in addition, about 5000 staff
- Financial strength: The balance sheet and income statement of the last five years of Nestle Group demonstrates that their financial position is strong enough to sustain itself as a market leader;
- Long experience: It has more than 150 years of experience, which helps to operate a business in more than 189 countries.
Weaknesses
- Unethical behavior of the employers: Nineteen leading NGOs have criticized and launched a boycott of this company to endorse the use of infant formula; however, six employers were punished for this unfair practice;
- Strategic decisions: Different policies of this company such as engagement of child labor, control over bottled water for profit, and fixation of the high price of its products had negative results.
- Other issues: Managing the global operations and a large number of individual brands, ensuring product quality and safety, avoiding legal actions, reducing unethical practices are the key weaknesses of this company.
Opportunities
- Business expansion: Nestle Group has the opportunity to enter more markets using its robust supply chain and strategic alliance with other companies for example Coca-Cola, L’Oreal, Colgate-Palmolive, and so on;
- Diversification: According to the annual reports of Nestle, it focuses more on the diversification of its food items to sustain itself as a market leader in this industry;
- Health consciousness: Nowadays, people all over the world become more health conscious, which gives the opportunity for this company to introduce easy and healthy breakfast items for customers;
- Research and development: It has 21 research centers to increase product quality and ensure safety by concentrating on research;
Threats
- Competition: Nestle Group has to face intense competition for every item both in the national and international markets; therefore, it becomes difficult to differentiate it from other brands;
- The volatility of price: Unstable prices of raw materials may hamper the implementation of strategic decisions and offer suitable pricing policy for the customers; therefore, total sales and net profit margin can decrease at any time;
- Purchasing power of the consumers: Due to the global financial crisis, purchasing power decreased, which adversely affected the international market growth;
- Unfair trade practices: In 2015, India identified that its product Maggi noodles contained lead, which exceeded the limit; therefore, it had to destroy 400 million noodles packets, which incurred huge losses;
- Diversified products: Most of the companies in this industry are operating business by offering highly diversified consumer products; consequently, buyers have extreme opportunity to choose different brands considering price, preference, availability, diverse features, and so on;
Corporate Strategy
Return on Shareholder
Nestle is committed to generating value for shareholders along with its strong portfolio, fastest-moving diversified product line, bulk investment, uninterrupted long-term growth that make sure that the company would continue to keep ahead of consumer trends. Nestlé has huge durable strength to remain at the top of the FMCG industry with its grand brand loyalty, successful record of accomplishment of long-run dividend distribution and sustainable top-ranking growth as well as long-term value creation for the shareholders.
Return on Total Assets (ROA)
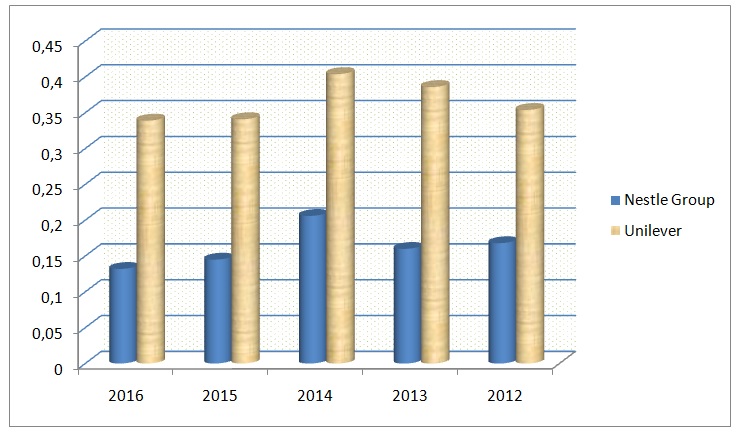
Table 4: Return on total assets of Nestle Group and Unilever. Source: (Nestle, Annual Report 2013 54), (Nestle, Annual Report 2014 5), (Nestle, Annual Report 2016 47), (Unilever, Annual Report 2013 3), (Unilever, Annual Report 2014 2), and (Unilever, Annual Report 2016 78).
The return on total assets of Nestle Group has significantly decreased in 2016 in comparison to 2014; on the other hand, the ROA of Unilever has slowly lessened in this period. This ratio plays a vital role to attract investors for which both companies need to focus on the implementation of new strategies for the development of ROA in the upcoming fiscal years; here, fig.2 shows the data of ROA graphically-

Return on Equity
Table 5: Return on equity of Nestle Group and Unilever. Source: (Nestle, Annual Report 2013 54), (Unilever, Annual Report 2013 3), (Unilever, Annual Report 2014 2), and (Unilever, Annual Report 2016 78).
Return on equity is one of the key indicators to quantify its efficiency level; however, calculation of ROE of Nestle Group that it has gradually decreased, which is not a good sign for this company; here, it is important to mention that Unilever has more capacity to produce revenue without having to use all the capital resources. Table 5 shows the calculation of ROE and fig.3 represents the data of ROE graphically-
Gross Profit Margin
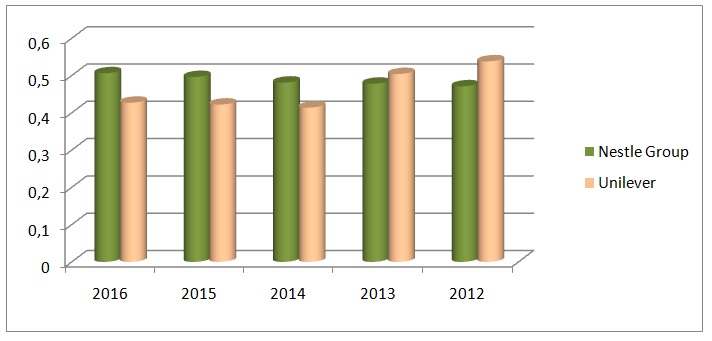
Table 6: Gross profit margin. Source: (Unilever, Annual Report 2014 2), and (Unilever, Annual Report 2016 78).
Table 6 shows the calculation of gross profit margin and fig.4 represents the data graphically-
Net Profit Margin
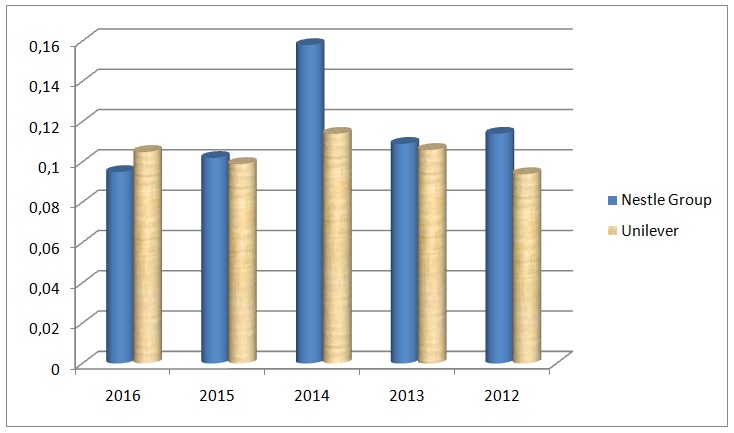
Table 7: Net profit margin of Nestle Group and Unilever. Source: (Unilever, Annual Report 2014 2), and (Unilever, Annual Report 2016 78).
This is an important ratio for both Nestle Group and Unilever because it directly illustrates the actual position of a company’s financial health; however, the above table demonstrates that the net profit margin of Nestle Group has slowly lessened over time and it reached the lowest position in 2016 and highest position in 2014. On the other hand, the calculation of the net profit margin of Unilever shows that it was dropped in 2012 and 2015, but Unilever handled the situation within a short period; however, Nestle Group should take initiatives to restore its market position. Fig.5 shows the data of net profit margin graphically-
Competitive Advantage
The competitive advantage is the prefix observation of the managers considering on the present external and internal factors that generate scopes and opportunity for the company to win over the rival companies in order to attain a greater market share and to do so, the companies take different strategic steps to gather more sales revenue. Nestlé emphasized the huge investment of its research and development with deep concern to the customers as a competitive advantage, it slogans ‘good food – good life’, but does not bother for charging a high price. On the contrary, Unilever addressed price discrimination as a competitive advantage and it facilitated the company to attaining a large market share in the less developed countries for affordable pricing.
Strategy Objectives & Goals
Marketing Objectives
The ultimate marketing objective of Nestle has aimed to attain its corporate goals in order to long-term maintenance of the expansion of the global market to sustain its uninterrupted growth and to do so the company has been carrying out different research and development in the global FMCG market.
Financial Objectives
The financial objectives of Nestle have aimed to attain its widespread value creation model by reviewing its capital structure, strategic priorities, shifting market dynamics, return on investment, interest rates in the market, a reflection of strong cash flow creation, growth opportunities in the financial market along with capital expenditure and property acquisitions by the company.
Target Markets
Target group varies for different individual products and brands; however, geographical regions and cultural factors also influence the company to select target market.
Strategies
- Creating Shared Value (CSV): Though this company has not any formal objectives, it considers a key of fundamental principles to do business; however, CSV is one of the main principles to create value both for shareholders and society; so, it focuses on the health and resilience of the stakeholders to meet its public commitments and enhance the quality of life;
- Understanding the customers: The main strategic goal of this company is to understand the customers’ behavior, trends, and needs in order to meet their demands to remain a market leader and bring long-term success; nowadays, many consumers cannot prepare meals due to shortage of time, and they are looking for prepared food and liquid beverages; so, it provides healthy food. Through research, Nestle identified that people want healthier and convenient life; therefore, this company is concentrating on goods with nutrition, health, and wellness benefits;
- Nutrition, Health and Wellness strategy: The founder of this company believed that good nutrition was the main factor to get a healthy life; therefore, its goal is to offer customers the tastiest and healthiest products;
- Increasing efficiency: It has already taken different initiatives in order to increase efficiency, for example, it decreased conversion costs, leveraged its purchasing power by forming global procurement hubs, increasing the use of shared services, and allowed local and regional decision-makers to take rapid action and so on.
- Allocating capital prudently: This company holds a market-leading position in different segments and ensures long-term growth by using wealth wisely; furthermore, it always reviews its brand portfolio, reexamines its capital structure, and assesses merger and acquisition prospects.
Business Strategy
To analyze the business strategy of Nestlé, this report will consider chocolate products because this company became popular worldwide for this item; chocolate makes up around 78% of its confectionery segment; however, Cailler, Crunch, and Kit Kat are the most famous brands.
Cost Leadership
Asia, Africa, and Oceania are the potential regions to expand the sales volume of chocolate products, but it generates only 18.61% revenue of chocolate products from these areas; however, the people of these locations have limited the purchasing power to afford the higher price. Thus, Nestle Group has the opportunity to become the market leader of the chocolate industry in these areas by reducing chocolate prices; in addition, being a well-established and experienced company, Nestle has the capacity to control costs and use distribution channels properly. At the same time, it can establish new factories in Asian and African countries to manufacture chocolate while labor costs are reasonable in these areas; however, cost leadership will not be a suitable strategy for European and American market since they give more importance to the taste and quality of the chocolate.
Table 8: Effectiveness of cost leadership strategy. Source: Self-generated.
Differentiation Strategy
Table 9: Effectiveness of differentiation strategy. Source: Self-generated.
Differentiation and Cost Focus Strategy
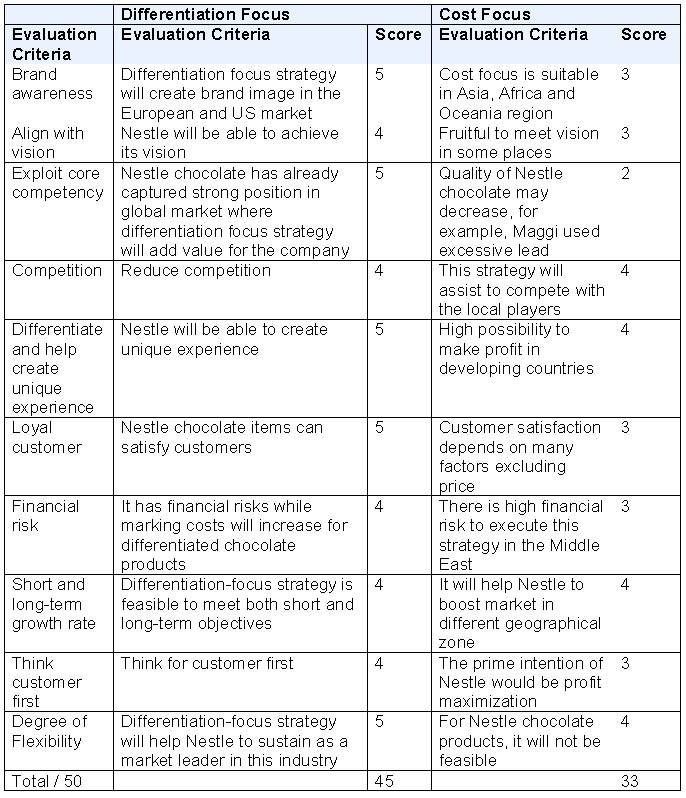
Competition
Unilever signed a long-term global partnership agreement with Barry Callebaut to gather 70% of its cocoa and chocolate products; however, chocolate ice-cream products of Unilever have a strong presence in the global marketplace as sales revenue increased by 3.5% in 2015 (Unilever, Annual Report 2016 15).
Product Offering
According to the annual report 2016 of Nestle Group, this company generated CHF 8.80 Billion from the confectionery segment where Kitkat and Cailler had a significant market share; on the other hand, the Magnum Double range, and the Ben & Jerry’s are the key brands of ice cream.
Implementation
- Promotion: To develop the market of new differentiated chocolate products, Nestle Group should increase the budget for promotional activities; here, it is significant to mention that Unilever captured a large market share of the cosmetics industry using this strategy; however, awareness regarding nutrition will play a vital role to attract children and other target customers;
- Packaging: It should use a new attractive packet to launch new differentiated chocolate products;
- Monitoring and evaluating performance: The management of Nestle should monitor the performance of the company and take necessary initiatives to upgrade chocolate product lines;
- Factories: At present, chocolate products are manufacturing in 35 countries though Nestle has 413 factories in 85 countries; thus, it should the number of factories for developing chocolate production;
- Communication with customers: As the largest food manufacturing company, it has the opportunity to develop customer relationship management in order to increase loyal customers;
- Sponsorship: The management of Nestle should carry on its sponsorship program to promote its brands;
Conclusion
Nestle is the greatest food manufacturing company in the globe and it has experience and efficiency to understand the customers’ trends and respond quickly; furthermore, it has a wide distribution channel, a large number of human resources, and a strong financial position. The balance sheet and income statements for the last five years demonstrate that the net profit of Nestle Group had decreased every year except in 2014, but other financial indicators represent that it was an extremely profitable food-manufacturing corporation. However, this company experienced many legal actions all over the world and experienced financial lose to obeying the Court orders, paying compensation, or destroying food packets; in this circumstance, the management of this company should develop ethical standards and enhance corporate value to provide quality products and reduce the number of claims.
Future Outlook and Recommendations
From the result of ROE, ROA, and net profit margin, it can be concluded that Nestle Group has failed to develop its financial performance though it makes a high profit each year; therefore, this company should conduct more research on market condition to identify the reason to fall the financial indicators and take measures to minimize risk factors.
Internal weakness and external threat analysis demonstrate that unethical behavior of the employers and unfair trade practices are the most common phenomenon of Nestle Group; therefore, “Good food, good life” should not be just a slogan to maximize sales, it has to practically focus on the implementation of this mission to ensure healthier life of the consumer.
Works Cited
Nestle. Annual Report 2013., Web.
Nestle. Annual Report 2014., Web.
Nestle. Annual Report 2016., Web.
Unilever. Annual Report 2013., Web.
Unilever. Annual Report 2014., Web.
Unilever. Annual Report 2016., Web.