NFL is among the most popular sports in the United States, with an ever-growing interest in the international arena. One of the key business issues in regards to the selected sport is the evaluation of player performance metrics, which is especially critical in regards to quarterbacks, who are responsible for scoring touchdowns (TDs). Therefore, there is a need to properly assess a player’s touchdown rate on the basis of other metrics.
The given analysis will primarily focus on Passing Yards (PY) assessment and its predictive capacity in regards to touchdowns. PY can be easily measured on the basis of historical data as well as on-field training sessions, where a player’s activeness can be potentially linked to one’s touchdown rates. In other words, the core question is whether a player’s PY score can predict his or her touchdown rates.
The relevant data collected for the analysis is derived from the Nextgenstats website, where all NFL-related data is provided. The touchdown raw data is taken from the top 30 athletes because they are the targeted quarterbacks and give the most plausible playstyle, which is in tune with the business question. Accordingly, the PY data is also collected from the selected players, which is denoted as YDS on the website (“Passing,” 2020).
The ranking is based on 2020 NFL data on touchdowns or TDs in order to make the assessment as up-to-date as possible. There are two sets of raw data; the first dataset is comprised of the top 30 TDs, which will be the dependent variable data, and the second is comprised of PYs, which is independent variable data. The average football field is 120 yards wide, but the plays take place within the 100 yards, which means that each TD takes place within these 100 yards (Athlon Sports, 2019). Therefore, PYs and TDs have a relationship, because each touchdown is made by passing certain amount of yards, and it can have the predictive capability since one’s PY will be directly indicative of his or her active movement measurements.
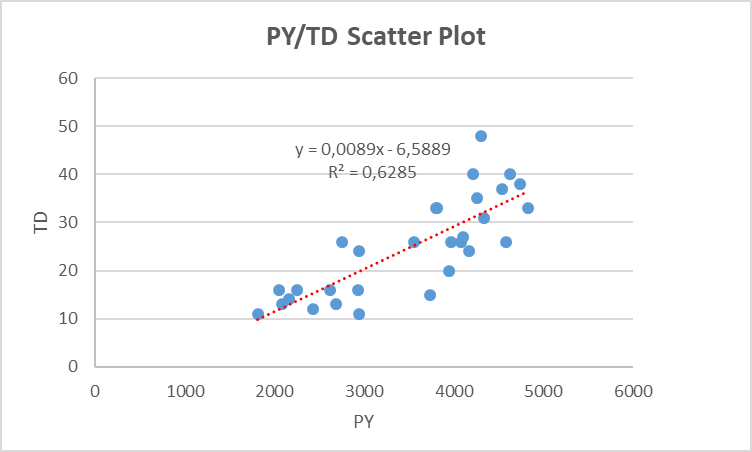
The scatter plot for each independent variables (TDs) and dependent variables (PYs) is presented in Figure 1. The R Square is equal to 0.6285, and the regression line formula is Y = 0,0089X – 6,5889.

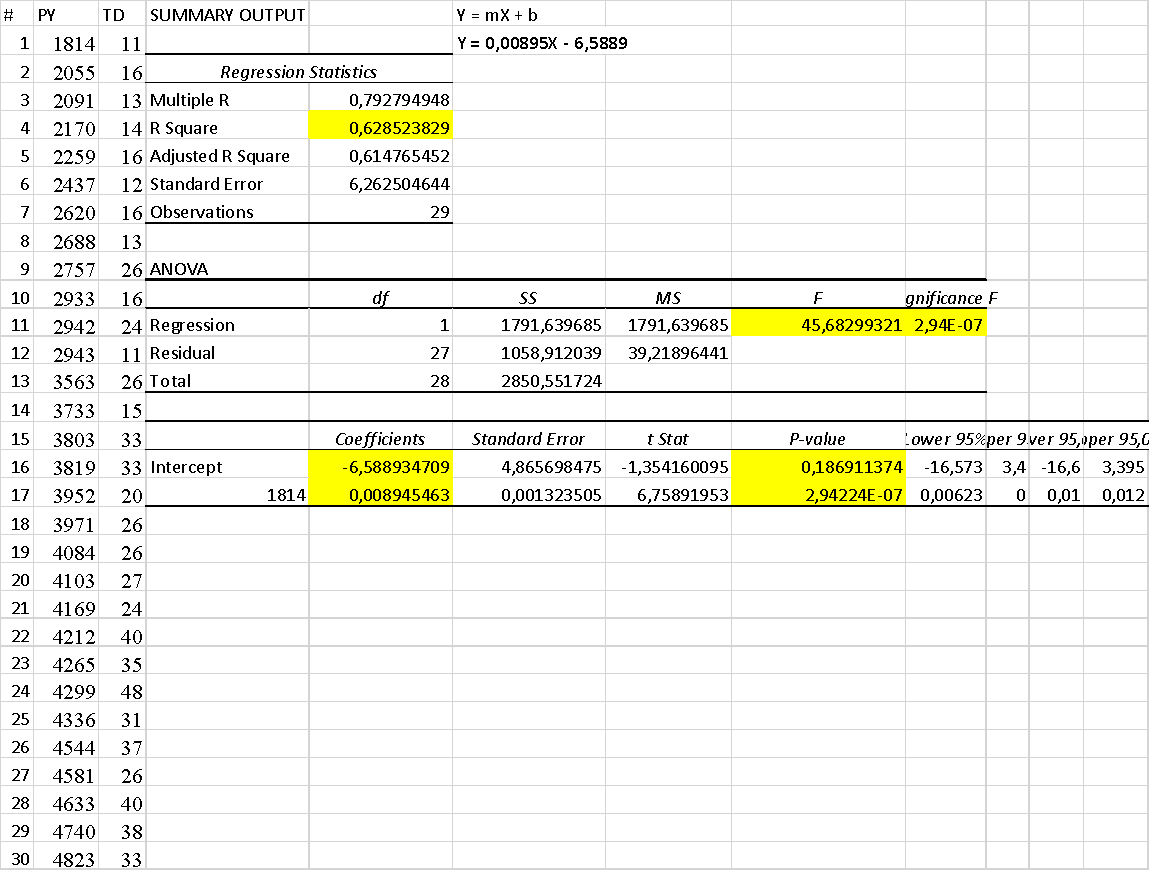
The appropriate analysis technique is a linear regression analysis, which is critical to determine whether or not there is a statistically significant relationship between an independent predictor (PY-independent variable) and the dependent target (TD-dependent variable). The first major step of linear regression analysis is to determine the “goodness-of-fit” factor through the R-Square value, which is equal to 0.6285. The given value means that fitness level for R-Square is high, which ranges from no fit of 0 to an ideal fit of 1 (“Linear regression,” n.d.). The next step revolves around determining whether or not there is a statistically significant relationship between two variables through p-value, which is equal to 0,000000294. F is equal to 45,683.
- Null Hypothesis: There is no statistical relationship between PY and TD.
- Alternative Hypothesis: There is a statistically significant relationship between PY and TD.
Since p < 0.05, the null hypothesis gets rejected, which means that there is a statistically significant relationship between PY and TD. The last step is centered around deriving the linear regression formula Y = mX + b, which is TD = 0,00895PY – 6,5889. Therefore, by inputting X or PY values, it is possible to predict Y or TD value. The F statistic is 45.683, and the p-value for the ANOVA is 0,000000294, and the latter is less than the significance level of 0.05. In other words, the Null hypothesis, that there is no statistically significant relationship between PY and TD, is rejected. The R-square value is 0.6285.
The inputs and outputs are presented in Table 1. The null hypothesis is that there is no statistical relationship between PY and TD. In Table 1, the “TD” and “PY” columns are raw data taken from the Nextgenstats website. The calculations are made through Excel’s Data functions called “Data Analysis,” where the regression analysis was selected in order to determine all important values, such as R-Square, p-value, F, m, and b.
The linear regression analysis is the most appropriate and plausible analysis technique because it allows for determining if there is a statistically significant relationship between an independent predictor (PY-independent variable) and the dependent target (TD-dependent variable). It also helps to identify trends for each PY value, and there is a possibility to predict a dependent variable or TD from an independent variable or PY. Linear regression is designed to predict continuous numeric variables. In addition, the modified version of linear regression implemented in the Deductor analytical platform also allows for solving the classification problem. Regression is the conditional expectation of a continuous dependent (output) variable for the observed values of the independent (input) variables.
Linear regression is based on the hypothesis that the desired relationship is linear. Each independent variable contributes additively to the resulting value with some weight, called the regression coefficient. Regression is called simple if there is only one input variable. However, such a model is too rough an approximation of reality, and in practice, as a rule, dependences on several variables are interesting. Despite its versatility, a linear regression model is not always suitable for qualitatively predicting the dependent variable (“Linear regression,” n.d.). For example, if the output variable is categorical or binary, different modifications of the regression have to be used.
The advantages of linear regression are the speed and simplicity of model generation. For linear regression, typical problems and their solutions are known, tests for assessing the static significance of the resulting models are developed and implemented. A large number of real processes in economics and business can be described with sufficient accuracy by linear models. The linear model is transparent and understandable for the analyst. Based on the obtained regression coefficients, one can judge how a particular factor affects the result and draw additional useful conclusions on this basis.

The results of the data analysis show that one can claim that a player’s PY or passing yard measurements can predict his or her rate of TDs or touchdowns. In other words, there is a statistically significant relationship between PY and TD. The linear regression analysis rejected the null hypothesis, which stated that there is no statistical significance between TD values and PY values. In other words, there is a strong statistical significance between PY and TD values of a player, which means that measuring one’s passing yard metrics can predict his or her touchdown rates.
The F statistic is 45.683, and the p-value for the ANOVA is 0,000000294, and the latter is less than significance level of 0.05. In other words, the Null hypothesis, that there is no statistically significant relationship between PY and TD, is rejected. The R-square value is 0.6285. y = 0,00895x – 6,5889. P-value is for the x coefficient is 0,000000294 (less than 0.05), thus x coefficient is statistically significant. The equation can be used to predict TD on the basis of PY.
The key limitation of the study is the fact that the linear regression analysis methods only look for an average mean value of the Y variable, which is TD. In other words, the technique focuses on assessing the corresponding correlational relationship between independent variables and the mean of touchdowns (Flom, 2018). In addition, the given approach can be considered highly sensitive to outlier values, where the latter severely skew the derived measurements (“Advantages and disadvantages of linear regression,” 2021).
The main recommendation on the basis of the acquired results is that coaches, team managers, and players should actively measure players’, especially quarterbacks’ passing yards or PY values during training and plays because it will be a strong predictor of touchdown rates of these players. In addition, a team owner and managers, who plan to acquire or buy a professional player, such as quarterbacks, from an existing team or recruit one from a newer pool of emerging players, should look for passing yard measurements because it will predict the touchdown rates of these individuals.
References
Advantages and disadvantages of linear regression. (2021). Web.
Athlon Sports. (2019). Football field dimensions: How long and wide is a football field?Athlon Sports. Web.
Flom, P. (2018). The disadvantages of linear regression. Sciencing. Web.
Linear regression. (n.d.). Web.
Passing. (2020). Web.