Introduction
Acid-base indicators are used to show the end-points of acid-base reactions. Most acid-base indicators, including bromocresol green, are regarded as weak acids. The indicator is a complex molecule that can be represented with the formula Hln, where ln- represents the anion. When applied to low concentrations, the indicators signal pH changes within a particular range, which is variable among the indicators. The color change depends on the relative acid strength (pKa) of the conjugate acid form of the indicator. The formula below shows how weak acids ionize in aqueous solutions:
- Equation 1:
- Hln(aq) + H2O ⇔ H3O+(aq) + ln–(aq)
- Quantitatively, the relationship between the hydronium concentration, H3O+, and the relative amounts of Hln and ln– in solution is described by the acid-dissociation constant, Ka. Based on the equation above, the acid strength is calculated as:
- Equation 2
- Equation 2 can also be represented as:
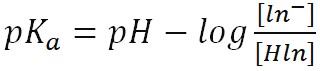
- Equation 3
- The ratio of the indicator concentration is controlled by the pH of the solution, while the solution pH controls the ratio of the buffer concentration. The pH of a solution is measured using a pH meter.


Aside from using a pH meter, Ka can also be determined spectrophotometrically by employing Beer Lambert’s law. According to the law, for substances to absorb light within the visible region of the electromagnetic spectrum, the absorbance or the amount of light absorbed is directly proportional to the molar concentration (1). Consequentially, the absorption curve of an indicator at various pH levels can be examined to determine the Ka of the indicator. This experiment aims to determine the pKa of an acid-base indicator, Bromocresol Green, using spectrophotometery.
Wenzel, T. (2018). Beer’s Law.
Experimental
Reagents
- Disodium Phosphate Solution, Na2HPO4, 0.20 M
- Citric Acid, C₆H₈O₇, 0.10 M
- Bromocresol Green Indicator, C21H14Br4O5S.
Solutions
- Disodium Phosphate Solution, 0.20 M. Dissolve the calculated amount of anhydrous disodium phosphate, Na2HPO4, or disodium hydrogen phosphate heptahydrate, Na2HPO4·7H2O, in about 200 mL of distilled water and dilute to the mark in a 250 mL volumetric flask.
- Citric Acid, 0.10 M. Dissolve the calculated amount of citric acid monohydrate about 200 mL of distilled water and dilute to the mark in a 250 mL volumetric flask.
- Bromocresol Green Indicator. Crush and mix 0.1000 g (exact mass is needed in order to calculate the concentration) of bromocresol green indicator with 14.3 mL of 0.010 M NaOH in a mortar. Transfer to a 250 mL volumetric flask and dilute to volume with distilled water.
- Buffer 1. Add 9.50mL of stock 0.1M citric acid solution to 0.50mL of stock 0.20M disodium phosphate solution. Dilute with distilled water to the mark in a 50mL volumetric flask.
- Buffer 2. Add 8.00mL of stock 0.1M citric acid solution to 2.00mL of stock 0.20M phosphate solution. Dilute with distilled water to the mark in a 50mL volumetric flask.
- Buffer 3. Add 6.00mL of stock 0.1M citric acid solution to 4.00mL of stock 0.20M phosphate solution. Dilute with distilled water to the mark in a 50mL volumetric flask.
- Buffer 4. Add 5.50mL of stock 0.1M citric acid solution to 4.50mL of stock 0.20M phosphate solution. Dilute with distilled water to the mark in a 50mL volumetric flask.
- Buffer 5. Add 5.00mL of stock 0.1M citric acid solution to 5.00mL of stock 0.20M phosphate solution. Dilute with distilled water to the mark in a 50mL volumetric flask.
- Buffer 6. Add 4.00mL of stock 0.1M citric acid solution to 6.00mL of stock 0.20M phosphate solution. Dilute with distilled water to the mark in a 50mL volumetric flask.
- Buffer 7. Add 2.00mL of stock 0.1M citric acid solution to 8.00mL of stock 0.20M phosphate solution. Dilute with distilled water to the mark in a 50mL volumetric flask.
- Buffer 8. Add 0.50mL of stock 0.1M citric acid solution to 9.50mL of stock 0.20M phosphate solution. Dilute with distilled water to the mark in a 50mL volumetric flask.
Instrumentation
- ThermoFisher Evolution Array Spectrophotometer
- pH meter
Procedure
The procedure listed in the Instrumental Methods of Analysis Chem 447 of the Winter 2021 laboratory manual was followed.
Eight buffer solutions were prepared from varied concentrations of the phosphate and citric acid solutions. The pH of the buffer solutions was then measured distinctly using a pH meter and recorded. Bromocresol Green indicator solution was then added to each buffer and then cuvettes containing the solutions placed in the spectrophotometer to measure their absorbance wavelength.
Results and Discussion
Absorbance measurements were performed using a Thermo Scientific Evolution Array Spectrophotometer in the wavelength range between 400 and 800 nm. Plots of absorbance against λ for the bromocresol green indicator in buffers with different pH levels are illustrated in Figures 1, 2, 3 and 4.
Table 1: Absorbance values at 444nm, 508nm and 619nm wavelengths as a function of pH.
Using values from the data table in Appendix 2, the Figures 1 and 2 were plotted for the absorbance at the 444nm wavelength.


Moreover, the values from the data table in Appendix 2, were used to plott Figures 3 and 4 for the absorbance at the 619nm wavelength.


Based on Figure 4, the inflection point is at the pH” of 4.5. At this point, pH” = pKa, hence the pKa, is also 4.5.
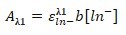
Buffer 1 is the most acidic. The molar absorptivity at Hln is:
- Equation 4:

- 0.25 =ε x 1 [0.95]
- ε=0.26
- Equation 5:

- 0.0152 = ε x 1 [0.95]
- ε=0.016
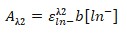
Buffer 8 is the most basic. The molar absorptivity at Hln is:
- Equation 6:
- 0.0484 = ε x 1 [0.95]
- ε=0.05
- Equation 7:
- 0.6884 = ε x 1 [0.95]
- ε=0.73


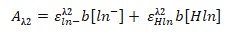
To determine, the pKa of the indicator, calculation using values for Buffer 5 were used as it has an intermediate pH.
- Equation 8:

- 0.1153 = 0.73 (0.1 – [Hln]) + 0.26 x 1[Hln]
- 0.1153 = 0.073 – 0.73 Hln + 0.26Hln
- 0.0423 = 0.47Hln
- [Hln] = 0.09
- Equation 9:
- 0.5003 = 0.73[ln-] + 0.26 × 0.09
- 0.5003 – 0.0234 = 0.73[ln-]
- [ln-] = 0.65

Ka = [0.65][0.0458]/0.09 = 0.33
pKa = 5.322 – log [0.65]/[0.09] = 4.46
The pKa value is essential and unique to every indicator. In this experiment, two methods were employed to determine pKa. The first method revolved around measuring the pH of the buffer solutions and determination of the absorbance. From the results, as in Figure 4, the inflection point was obtained, and it was found to be 4.5 (inflection point = pKa). As a result, the experimental value of this pKa was almost equal to the theoretical pKa of bromocresol green that is 4.7. The percentage error can therefore be calculated as: % error = experimentalvalue – actualvalue / actualvalue x 100% = 4.5 – 4.7/4.5 x 100% = 4.4%
The experiment had an experimental error of 4.4% which is small, thus acceptable.
On the other hand, the second method utilized the Henderson-Hasselbach equation and the Beer’s Additive Law to determine the linear relationship between pH and concentration of solutions. For the second, method, the pKa was calculated at 4.46 and this is almost equal to that of the first method.
The difference in the experimental and theoretical pKa values suggest the occurrence of experimental errors. These might be due to stray radiation or errors in measuring the volume of solutions, which interfered with the absorbance values and ionic strength of the various solutions, respectively. As a result, this had a consequent effect on the overall findings.
Aside from the UV-VIS Spectrophotometry, the experiment can also be conducted using Agilent Technologies Carry 8454 UV-Vis that provides more accurate results (2).
Summary
The application of spectrophotometric titration allowed the pKa of Bromocresol Green to be determined. Two methods of analysis (graphical and additivity of Beer’s Law) were employed and generated results with good similarity. The isosbestic point was also determined. In comparison, the first method proved to be more accurate than the second.
References
Wenzel, T. (2018). Beer’s Law.
Shokrollahi, A., & Firoozbaakht, F. (2016). Determination of the acidity constants of neutral red and bromocresol green by solution scanometric method and comparison with spectrophotometric results. Beni-Suef University Journal of Basic and Applied Sciences, 5(1), 13-20.
Appendix 1. Answers to Questions
- Compare the calculated pKa (both graphical and additivity of Beer’s Law) with the literature value. Provide references.
- The calculated pKa for the graphical and additivity of Beer’s Law method were less than the theoretical value which is 4.7 (2). This difference is attributed to the presence of experimental errors.
- What is the isosbestic point in this experiment? From your data, estimate the isosbestic point for bromocresol green. Explain.
- The isosbestic point is at pH 3. It is at this point that the absorbance of 444nm and 619nm is almost equal.
- Enumerate the necessary conditions for the additivity of Beer’s law concept to be successful.
- Solutions must be dilute
- Solutions should have a concentration of less than 10-2 M
- List the electronic transitions encountered in the UV-Visible absorption regions in organic molecules? What type of electronic transition do you think is responsible for the absorption spectrum of bromocresol green? Briefly Explain.
- n-π* transitions
- π-π* transitions
- n-σ* transitions
- σ-σ* transitions : These types of transitions are related to the promotion of an electron from a σ bonding orbital to σ* antibonding orbital. This type of transitions is common for saturated organic molecules without hetero-atoms. These are allowed transitions. Usually this transition occurs below 150 nm. These transitions cannot be observed in commercial spectrometers (200 nm – 750 nm).
- What is stray radiation? When does its effect on spectrophotometric measurements become most serious?
- It is any light reaching the spectrophotometric detector that lies outside the wavelength band width selected for analysis by the monochromator. The effect becomes significant at higher concentrations as the stray light component becomes a larger part of the total transmitted light at such concentrations. In other words, stray light reduces the linearity of response of the instrument.