Abstract
The objective of this experiment was to determine the concentrations of unknown samples using UV/VIS Spectroscopy. As such, two experimental setups were performed using 0.04 M. potassium dichromate. The first was to determine the unknown concentrations of samples A and B using linear dilution while the other employed the serial decimal dilution method.
From the results, it was established that the concentrations for samples A, B, 2A and 2B were approximately equal to 0.018M and 0.0026 M, 0.002M and 0.012M respectively. Also, the results trends of the graphs were consistent with Beer’s law.
The concentration rates are approximations thanks to the systemic and random errors experienced e.g., stray radiations which may be minimized but not eliminated completely
Introduction
Many molecules are sensitive to UV light such that they absorb this light at a specific wavelength different from another element. The degree of absorbance is proportional to the intensity of the beam (Skoog, West & Holler, 1992).UV-VIS Absorption Spectroscopy is an analytical technique that derives its operation principles from Beer’s law which states that: “Absorbance is directly proportional to the path length, b, and the concentration, c, of the absorbing species” (Sigurds, 1986). This can be represented mathematically as A= εbc, where ε represents the constant of proportionality, known as absorbtivity. With this principle of operation, and absorbed spectrum portrays a band pattern corresponding to the constituent structural groups making up the molecule (Skoog et al., 2004).
Objective
The aim of performing this experiment was to determine the concentrations of unknown samples using UV/VIS Spectroscopy.
Procedure
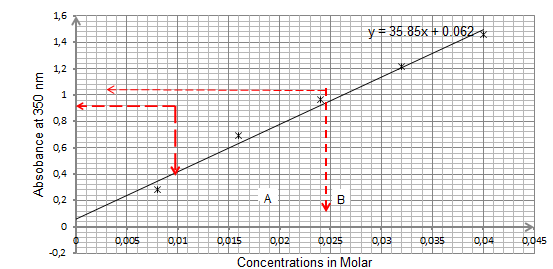
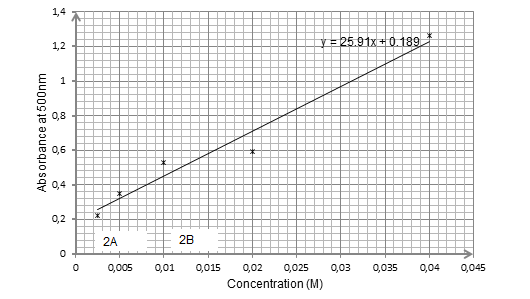
In this experiment, two setups were arranged. While the first one was to achieve the objective courtesy of linear dilution, the latter employed the use of serial dilution. As such, for the first one, 0.04M potassium dichromate solution was diluted linearly to obtain data of concentrations and its corresponding absorbencies using a UV/VIS spectrometer. A graph of absorbance versus concentrations was plotted to generate a standard curve vital in determining unknown samples A and B. For the other setup though using the same concentration of potassium dichromate, a serial dilution was done to develop a standard curve vital in the determination of samples 2A and 2B.
Results
With regards to the experiment, the data below were obtained.
Table 1: Showing linear dilution.
Table 2: of experiment’s serial dilution.


Discussion and Analysis
As exhibited by graph 1 above, for samples illuminated at an absorbance of 350 nm, the concentrations for samples A and B are approximately equal to 0.018M and 0.0026 M respectively. On the other hand, for the samples illuminated by absorbance of 500 nm, as portrayed by graph 2, the concentrations for samples 2A and 2B are approximately equal to 0.002M and 0.012M respectively.
To achieve consistent results for this experiment the solution should have been maintained at a concentration not exceeding 0.01M. Otherwise, there would be a deviation from Beer’s law thanks to the interaction between neighbouring molecules (Hawthorne & Thorngate, 1979). This error, a random type, can be eliminated by maintaining the prescribed concentration below 0.01M (Szalay, 2008). Moreover, a systemic error such as stray radiations can lead to uncertainty concerning Beer’s law thanks to instrumental artifacts. However, this can be decimalized by the use of absorbance of a range between 0.3 and 1 since they are less vulnerable to stray light noise problems notwithstanding (Steiner, Termonia, & Deltour, 1972).
HPLC is one area where UV/VIS Spectrophotometric-standard curve technique is applicable. As such, a UV/VIS spectrophotometer acts as a detector responsible for the peaks, which corresponds to concentrations of the analyte. Just like calibration curves, there ought to be a standard sample for reference (Vandenbelt & Henrich, 1953).
The calculation that follows reveals the amount in grams of K2CrO7 that would be required to prepare a 0.2M standard solution in a 100ml standard flask. Then the number of moles of K2CrO7 required is given as below:
From equation, mole=Molarity*Volume;
mole= 0.2*100 =0.002 moles
Therefore, mass of K2CrO7 required =0.002*Formula mass=0.002*242.2 =0.4844 grams.
The calculation that follows will reveal the amount in volume of 0.05M working standard solution of dichromate required to obtain a final concentration of 0.005M in a 5ml volume test tube. We need to obtain 5 ml of 0.005M sample from 0.05M. Therefore, a volume of 5*0.005/0.05 ml which is equivalent to 0.5ml of the dichromate is required to prepare the sample.
Serial dilution is a consecutive dilution of a solute in a solution. As such, the concentration assumes a geometric progression sequence with a constant dilution factor just like in table 2 above (Szalay, 2008). This method is useful in creating exceedingly high diluted solutions as well as decreasing the concentration of minute organisms or unicellular cells present in a sample.
Conclusion
In synopsis, it can be concluded that the objective of the experiment was met since it was possible to determine the concentrations of samples A, B, 2A and 2B as 0.018M and 0.0026 M, 0.002M and 0.012M respectively. Also, the results trends of the graphs were consistent with Beer’s law.
References
Albert, A., & Serjeant, E.P. (1971). The Determination of Ionization Constants: A Laboratory Manual. Kansas City: Chapman & Hall.
Atkins, P.W., & Jones, L. (2008). Chemical Principles: The Quest for Insight (4th Ed.). Vatican CityState: W.H. Freeman.
Department of Chemistry. (2008). Redox Reactions. Web.
Hawthorne, A., & Thorngate, J. (1979). Application of Spectroscopy. Birmingham City, UK: University of Alabama.
Hulanicki, A. (1987). Reactions of acids and bases in analytical chemistry. New York City: McGraw-Hill Companies Inc.
Kenkel, J. (1994). Analytical Chemistry for Technicians. Boca Raton, US: Lewis Publishers.
Perrin, D.D., Dempsey, B., & Serjeant, E.P. (1981). pKa Prediction for Organic Acids and Bases. Kansas City: Chapman & Hall.
Reichardt, C. (2003). Solvents and Solvent Effects in Organic Chemistry: Solvent Effects on the Position of Homogeneous Chemical Equilibria. New York City: John Wiley & Sons, Inc.
Scorpio, R. (2000). Fundamentals of Acids, Bases, Buffers & Their Application to Biochemical Systems. Birmingham City, UK: University of Alabama.
Sigurds, S. (1986). Applications Of UV-Visible Number UV-31 Derivative Spectrophotometry. Steinhauserstrasse, Switzerland: Peter Lang Publishing Group.
Skoog, D., West, D., & Holler, F. (1992). Fudamentals of Analytical Chemistry. Fort Worth, US: Saunders College Publishing.
Skoog, D.A.; West, D.M.; Holler, J.F.; Crouch, S.R. (2004). Fundamentals of Analytical Chemistry (8th ed.). Salt Lake City: Thomson Brooks/Cole Publishers.
Steiner, J., Termonia, Y., & Deltour, J. (1972); Analitical Chemistry. Geneva: ILO Publications.
Szalay, L. (2008). Atomic Absorption Spectrophotometry (AAS). Budapest, Hungary: Petrik Lajos Publications.
Vandenbelt, J., & Henrich, C. (1953). Application Spectroscopy. Geneva: ILO Publications.