Introduction
This paper seeks to analyze Wal-Mart, as the chosen US publicly-traded company with either a subsidiary or division operating outside of North America and its common stock as a prospective investment for the purpose of this paper.
Analysis and Discussion
Company Overview
Since its incorporation in October 1969, Wal-Mart Stores, Inc. (WMT), has become a well-known company in its operation of retail stores in various parts of the world. Its provision of a variety of merchandise and services under the three segments of doing its business which includes the Walmart US, International, and Sam’s Club, may have played a part. Sixty-four percent (64%) of its sales revenues in the fiscal year 2009 ending in January falls under the Walmart US. as an operating segment.
The company operated its store in 2009 under three different formats of discount stores, supercenters, and Neighborhood Markets in the US, including its use of walmart.com for the company’s online retail operations.
For its international segment, which accounts for 25% of its 2009 fiscal year sales, it had a number of retail operations in more than a dozen countries and Puerto Rico. Said international segments exhibit basically follows the format adopted by Walmart US segment. Interestingly, Sam’s Club operates as a warehouse membership club in the US and its online retail operation segment. This last segment accounts only for about half of the international segment based on 2009 total sales (Reuters.com, 2009a).
Walmart US Segment
Three formats essentially dominate the Walmart US segment. Two of these are the more familiar and more dominant formats. These are discount stores and supercenters. The third format is the Neighborhood Markets which, although less familiar than the two, have contributed to revenues of the company. Together with the three formats, this segment serves through walmart.com as well. This segment operates retail stores in almost all states of the US.
The familiarity of stores, discount stores, and supercenters is evident in almost 47 to 48 states of the US, while Neighborhood Markets are found only in a smaller number of states of less than 17 states. Sizes of discount stores fall within the range of 29,000 to 220,000 square feet, having an average size of more than 100,000 square feet. Supercenters are bigger, with an average size of 186,000 square feet approximately. Smallest in number and smallest also in size are the Neighborhood Markets range with an average size of 42,000 square feet approximately. Other customers, of course, are served online at www.walmart.com, where the size of the store is not an issue (Reuters.com, 2009a).
The Walmart US segment, which serves under three formats mentioned, delivers and sells customers grocery merchandise in many forms, consumables like beauty aids and paper goods, entertainment merchandise such as cameras and supplies, electronics, merchandise hardlines, photo processing services, toys, and cellular phones and service plan contracts, a variety of apparel merchandise for all sexes and several age categories, products related to health and wellness, and home merchandise (Reuters.com, 2009a).
In relation to the need to process payments of its products, the same US segment makes available financial services and products to its customers, and customers can avail of bill payments, money orders, check to cash, and wire transfers.
International Segment
The International segment includes subsidiaries that are wholly owned or controlled or majority-owned by WMT as those that operate in Latin American countries of Argentina, Brazil, and Puerto Rico, Chile and Mexico, the Asian countries of Japan, India, and China, and European country of the United Kingdom, its subsidiaries operating in five countries in Central America, and in Chile and Mexico, the company’s joint ventures in India and China and its other controlled subsidiary in China.
In 2009, the WMT sold the UK property. WMT uses more than 140 distribution facilities that could be found in Chile, China, Costa, Brazil, Argentina, Canada, Rica, Mexico, El Salvador, Japan, Nicaragua, Guatemala, and Honduras, the United Kingdom, and Puerto Rico and consolidation facilities for export in the United States. From these facilities, the company moves its products that may be imported and those produced domestically to its international segments (Reuters.com, 2009a).
Sam’s Club Segment
This operates as a warehouse club requiring membership, and WMT operates the same in 48 states of the US. The size of the facility for Sam’s Clubs averaged 133,000 square feet approximately. This is not therefore considered as part of the international segment, and its sales could safely be included as part of domestic sales revenues. The segment additionally provides its members a variety of goods and services online under www.samsclub.com. As a warehouse club, the segment males bulk displays consisting of its merchandise under different brands. The segment also deals with some softgoods, hardgoods, and grocery items, and items that are privately labeled (Reuters.com, 2009a)
Ratio analysis
Table A below starts the analysis for this section.

Profitability and efficiency
The summary of the table below indicates an increase in revenues within the range of 7% to 12% from 2006 to 2009, but the net profit margin was found to have remained at 3% for the years 2007, 2008, and 2009 after it declined from 4% level in 2006. The behavior of the profitability ratios appears to be consistent using return on assets and return on equity. The decline was noticeable in 2007 from 2006 and from 2007 towards 2009, the rates have remained almost the same.
This is despite the fact that the highest revenue increase was noted in 2007 compared with the other years from the last five years. Thus when the behavior of the profitability was used as a basis for forecasting the next three years using Microsoft Excel, the apparent result was a felt decline after Year 2 in the future since the historical fast showed the decline after two years. If the projection were made further, it could be assumed that Year 3 profitability ratios would be maintained.
That is, however, assumed on the basis that what happened in the past will be repeated. Since conditions change, it is still possible that profitability would still be improved. The present level of return on equity may still be considered very high in terms of return on equity (Meigs, R., Meigs, W., & Meigs, M. 1995).
Liquidity
A company is liquid if it can meet its currently maturing obligations. Liquidity gets measured by the quick ratios and current ratios (Meigs, R., Meigs, W., & Meigs, M. 1995). WMT current ratios showed 0.90, 0.82, and 0.88 for the years 2007, 2008, and 2009, respectively, or an average of 0.87 for the last three years. Refer to Table A.
For a company to have good liquidity, the ratio of current to current liabilities should be at least one since this would mean that a company must be able to match 1 dollar from its current assets to the dollar of its currently maturing obligations.
Failure of a company to do could mean bankruptcy and may compel the company to stop operation or become bankrupt. If the salaries of its employees which must come to every payday cannot wait, so with the payment of to suppliers which need also working capital to keep their business running. For a more strict measure of liquidity, a company must have ready quick assets to match maturing obligations include cash, marketable securities, short-term investments, accounts receivable, and notes receivable. Quick assets are part of current assets and may also be derived by deducting inventory, prepaid expenses, and other current assets from the current assets.
Using the principles discussed in the case of WMT, its current ratio for all of the past five years was less than 1.0; hence there is evidence to conclude the both have weak liquidity, which needs improvement.
Solvency
Solvency is, in a sense, expanded liquidity since it o measures the ability of an enterprise to pay its debts with available funds like cash and cash equivalents which are presumed to exist (Meigs, R., Meigs, W., & Meigs, M. 1995). It is expanded since it is meant to address long term or the financial stability of the company as it aims to survive based on sufficient investment from stockholders and properly matching the long-term debt of the company together with currently maturing obligations (Brigham and Houston, 2002).
To apply the principles in the case of the company under examination, WMT’s long-term debt to common equity ratios for WMT showed 1.46, 1.53, and 1.50 for the years 2007, 2008, and 2009, respectively, or an average of 1.50. The ratios are quite high since greater than 1.0 means that a company ad more debts on average than equity. Thus the company could be considered risky and highly leveraged.
Stock price analysis
Research the company’s common stock price for the past five years. Research the Standard & Poor’s Market Index (S&P 500) for the past five years. Chart the price movement in the company’s common stock against the S&P price movement. State and support your opinion on the company’s common stock as an investment today.

The company’s commons stock price for the past five years indicates an increasing a slightly decreasing trend from last part of 2004 up to middle of 2005 and from that point, the prices exhibited slight fluctuations up to the middle of 2007. From the middle of 2007, it showed an increasing trend until the middle of 2008, when it exceeded the S&P 500 Index performance. From the last point mentioned again showed decreasing up to the present. The present level price is slightly lower from the start of the graph about the middle of 2004. Thus, it could be inferred that the prices may have improved at some point for the last five years, but overall it would appear that there was no improvement on average from the start of analysis over the past five-year period.
As an investment option today, it could be concluded that prices may not go up still until the recession has finished, and the highest price that could be attained for the next three years may not reach the peak that in achieved in the middle of 2008. This means that an investor may take caution of buying many stocks from the company and that it is best to either dispose of now or hold present stockholding and sell the same when the prices would go up in the near future. Buying stocks of the company is the least recommended.
Foreign operations
Select a company subsidiary or division operating outside of North America and describe the subsidiary’s or division’s operation, location, markets (s), and line(s) of business, and how they relate to the parent company’s operation. Compare the financial growth of the parent company’s domestic operations with the growth of its overseas operations for the past three years.
WMT has its subsidiary outside of North America, as evidenced by its international segment. Its international segment, as described earlier, refers to those that are outside the US. It must be noted that its international segment constituted about 24% of the total revenues in 2009 as against 64% to that of Walmart US and 12% for Sam’s Club. The difference is more than triple in favor of the domestic operation segments constituting a total of 76% from the US. The financial growths of US and non-US sources of revenues are evident from Table B, where Walmart US grew only with the range of 6 to 7% for the years 2008 and 2009 and Sam’s Club increased within the range of 4 to 6%, for the same years while International segment grew by 9 to 18%
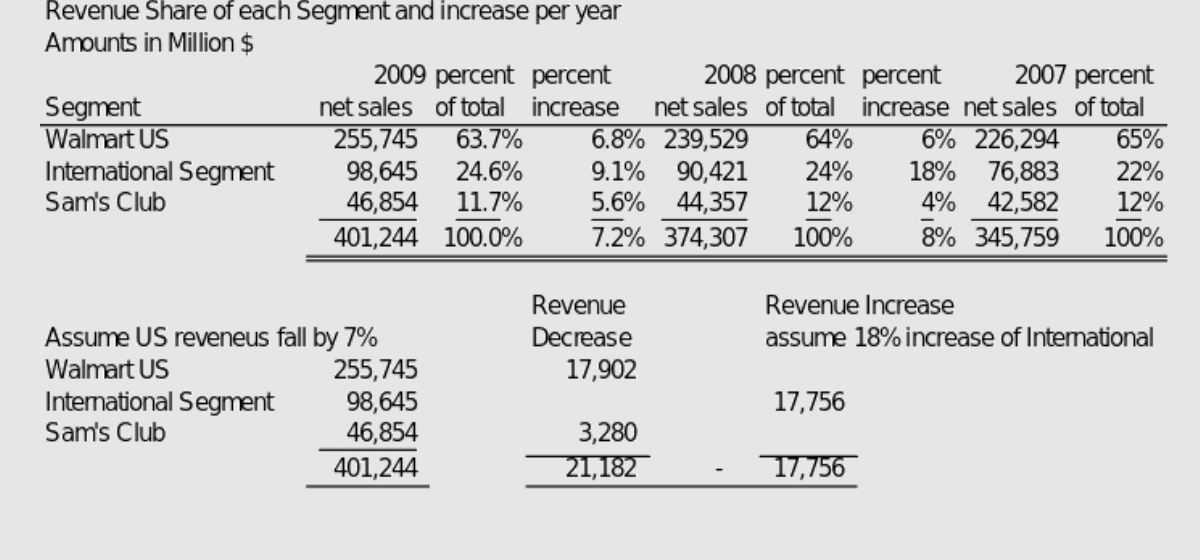
If the financial growth of the parent company’s domestic operation falls by 7% from 2009 revenues, the decrease in revenues would be about $21 billion, and if the non-US revenues increase by 18%, which is not likely, the expected increase is only $17 billion in revenues. This means that the big share of revenues coming from the US could not be easily covered, assuming more than double the rate of fall in terms of increase from non-US sources. Refer to Table B.
Global Analysis
The issue on whether, in the event of an economic slowdown in the US, the company’s overseas revenue generation might serve to shelter the parent from slow or negative growth in the US market depends on the size of the foreign or international operation. It can be shown that Wal-Mart derives most of its businesses from the US. About 64% of its total revenues come from the US Walmart segment and an additional 12% from the membership club segment or a total of 76% of the 2009 revenues coming from the US or about three-fourths of the same revenues.
To determine, therefore, whether the foreign revenue generation might serve to shelter the parent from the slow and negative growth in the US, it would seem that the revenues from the foreign sources (assuming that there will be an increase of 18% as shown earlier) will not still be enough to shelter the parent’s fall in revenues by about 7%. See Table B. Moreover, the recession causing negative growth in the US is not limited to the US but extends worldwide. Thus the chance of expecting non-US revenues source to shelter the parent become smaller (BBC News, 2009).
Conclusion
It can be concluded that Wal-Mart’s operations mainly come from the Walmart US segment constituting about at least 64% of total revenues and Sam’s Club about 12%. Summing the two would produce 76% of total revenues that come from the US. The remaining 24%, therefore, comes from its international segment. As to whether revenues outside the US would affect its chances of sheltering the parent company of the US, it could be concluded that the chances would not be that high considering the small portion of revenues that could come from outside the US. The chance of sheltering is made smaller given that the effect of recession is not limited to the US.
Therefore the Wal-Mart would have to brace for more difficult times if its domestic operation would likely have to suffer from a slowdown in revenues because of expected negative growth in the industry. The expected decline, however, would not be that big that push the company into bankruptcy since the company deals in an industry that addresses most of the basic needs for survival, and therefore the company may less affected compared with other industries.
For common stock investment purposes, buying WMT stock is not recommended at this point due since prices of stock are not expected to go up in the near future, but it is not necessarily dangerous because the company has a very high ROE.
References
BBC News (2009), Global Recession. Web.
Brigham, E. and Houston, J. (2002) Fundamentals of Financial Management, Thomson South-Western, US.
Meigs, R,. Meigs, W., & Meigs, M. (1995) Financial Accounting, McGraw-Hill, New York, USA.
MSN (2009), Stock Price Graph of Wal-Mart for the last five years. Web.
Reuters.com (2009a) Company Profile of Wal-Mart. Web.
Reuters.com (2009b) Financial Statements 2007 to 2009. Web.
Wal-Mart (2009), Annual Report of Wal-Mart for 2009. Web.