Objectives
- To determine the effect of fossil fuel use on the atmosphere up to the year 2100 if the estimated rate of use is accurate and maintained over nine decades.
- To determine the amount of carbon dioxide in the atmosphere causing global warming in the next ten decades, if the estimated rate of deforestation is maintained.
- To explore how human activities affect the concentration of greenhouse gasses in the atmosphere.
- To understand how the factors mentioned above may affect climate change in the future.
Results
Table 1 – Effect of Fossil Fuel Use on CO2 (Change Fossil Use –Keep Deforestation Same)


Table 2 – Effect of Deforestation on CO2


Discussion
Table 1
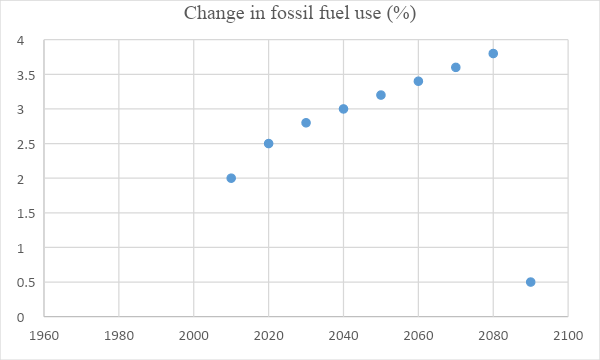
According to graph 1.1, the use of fossil fuels for Industrialization in the world rises steadily every year. By the end of the 2080s, the rates of burning fossil fuels are expected to be almost double if the practice maintains its upward trend. However, by 2090 the fuel usage drastically drops to 0.5% within the eighth decade. Assumptions are that the number of human activities requiring the burning of fossil fuels will be reduced and alternative sources of energy applied.
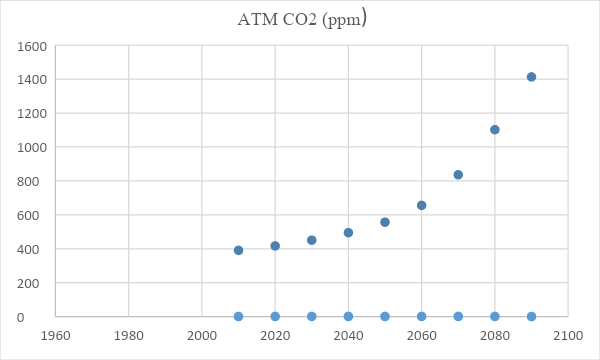
The second graph, 1.2, illustrates the effect of the rising trend of burning fossil fuels on greenhouse gasses, in this case, carbon dioxide (CO2). Similarly, the amount of carbon (IV) oxide gradually rises within the eight decades in this study. This rising trend is a consequence of the increasing rates of usage of fossil fuels in the world. The amount of CO2 in the atmosphere is seen to double by the end of the sixth decade and triple by the end of the eighth. It continues spiraling in 2090, even with the reduced use of fossil fuels, resulting from an already damaged ozone layer.
Table 2
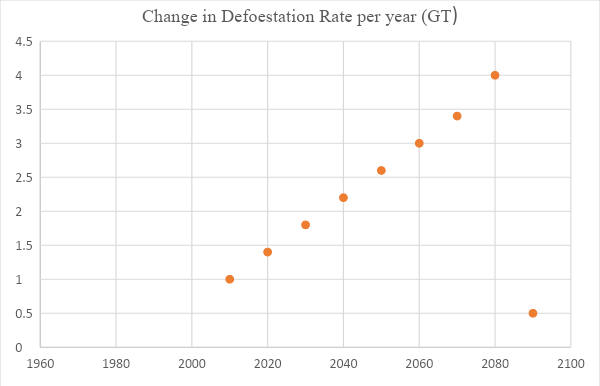
According to the study of human activities, deforestation is expected to continue, increasing the rates at which it is practiced by the year. According to graph 2.1, deforestation rises steeply within the first seven decades. It means that the rate at which human beings clear vegetation is set to increase significantly in the future. Within the eighth decade, the deforestation rate reduces hugely to 0.5, the lowest rate recorded in the results. Assumptions are that most of the land previously occupied by vegetation will now harbor most human populations and urban areas whose space is created through deforestation.
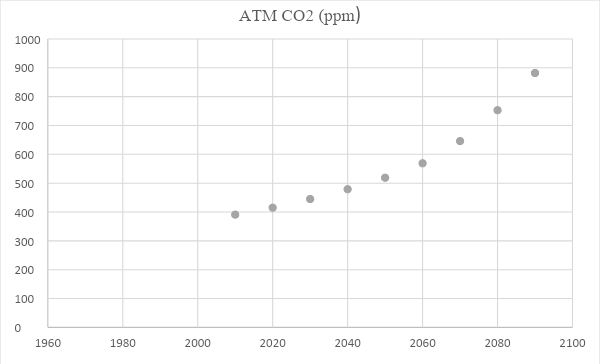
Graph 2.2 shows the consequences of deforestation on the atmosphere in terms of the concentration of carbon dioxide. Unlike the graph depending on fossil fuels, carbon (IV) oxide in the atmosphere rises slower, with the amount doubling within the eighth decade. However, the amount of CO2 keeps rising by 2090, even with the reduced deforestation rate like it does in graph 1.2. The graph from 2010 to 2050 slowly rises and then steepens from 2050 up to 2090 when deforestation rates ascend above 2.5GT. This shows that the concentration of CO2 in the atmosphere is directly proportional to the degree of deforestation with an exemption of extreme impacts of the eighth decade.
Conclusion
Human activities are the leading causes of increasing greenhouse gasses in the atmosphere. From the above experiment, these activities directly affect the concentration of carbon dioxide in the atmosphere; for instance, burning fuels such as coal releases carbon into the environment. Continuous burning of these fuels, therefore, increases the absorption of the greenhouse. As per the results, this trend is set to go on for many years as the world expands through Industrialization.
Deforestation is likewise a leading source of global warming; when trees and other vegetation are cut down, it releases all their stored carbon into the environment (Panja). Whether the trees are burnt down or not, carbon is released, reacting with oxygen to create carbon dioxide. The amount of oxygen is also reduced since vegetation is its primary source on earth. Human beings, however, will continue felling trees to create space for urbanization and agriculture, thereby increasing the risk of a high concentration of carbon dioxide.
The high concentration of greenhouse gasses causes global warming, “a phenomenon where the earth’s overall temperature is increased.” According to the above statistics, global warming is the most significant risk to climate on earth. When carbon dioxide becomes highly concentrated in the atmosphere, most energy absorbed by the planet from the sun is trapped by these gasses and retained in the atmosphere instead of being reflected to space; the greenhouse effect that causes global warming.
As a result of global warming, temperatures on earth increase and cause climate change in different ways. Extreme temperatures could cause drought in some areas and increase rates of precipitation in others. In areas covered by snow, it could melt and raise the water table. Climate change may cause risky weather conditions that eventually change the earth’s occupants’ lifestyles and cycles. Global warming is the factor that will ultimately deteriorate the world, its natural processes, and its nature.
Work Cited
Panja, Prabir. “Deforestation, Carbon Dioxide Increase in the Atmosphere and Global Warming: A Modelling Study”. International Journal of Modelling and Simulation, vol 39, no. 1, 2019, pp. 1-11. Informa UK Limited.