The practice of gathering and classifying information regarding different climatic conditions of the world has become an important way through which effective understanding of various climatic patterns and seasons can be attained. This paper takes a critical look at the Koppen climate classification system of San Francisco city and Salt Lake City, Utah.
San Francisco
Physical geographic description
San Francisco is one of the major cities in the United States with a population of about 7.5 million people (Haug 646). It is located on the West Coast and closely stretches and borders the San Francisco Bay and the Pacific Ocean. The city has several Islands which surrounds.
Some of these islands include Angel Island, Almeda Island, Yebra Buena Island, treasure, and Alcatraz Islands. Besides, it has offshore uninhabited islands called the Fallaron which covers an area of 43 kilometers. In total, the city occupies an area of 600 kilometers (Haug 646).
San Francisco city can be best described by its famous landscape which has more that 50 hills. Settlements which have developed along the hilly areas have come to be named after the hills. Some of the neighborhoods include Russian Hill, pacific Heights and Nob Hill (Metcalf 444). San Francisco’s mount Davidson forms that highest hill with a height of about 282 meters. In addition, the city also has faults like Hayward and San Andreas which are areas that attract earthquake activities.
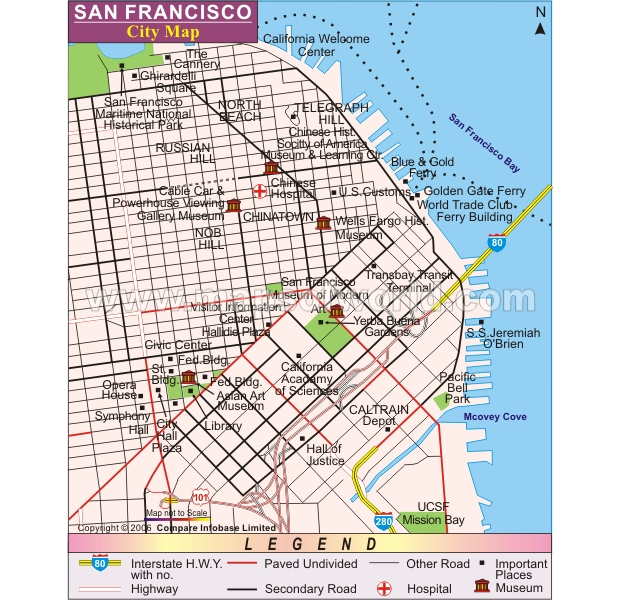
Figure 1: A figure representing the map of San Francisco
Climate
The climate in San Francisco has been described as a cool-summer Mediterranean climate (Wang and Overland 46). Studies indicate that it is characterized by dry summers and moist mild winters (Wang and Overland 46). The moderate temperatures swings mostly experienced in the city are due to the three water bodies surrounding it.
Using the Koppen climate classification, San Francisco has a climate classification which falls under the Csa and Csb categories, that is for dry summer subtropical climates. San Franciso experiences seasonal temperature variations with Koppen-Geiger system classifying them at 18-22 degrees Celsius high and 11-13 decrees Celsius low between May and October (Jin and Shepherd 682).
Seasonal changes, precipitation averages and temperature changes
In terms of seasons and temperature changes, San Francisco unlike many cities in the Mediterranean, does not experience very warm summers and relatively mild winters. Instead, its summers are mild, a factor that is attributed to regular summer fogs and onshore breeze caused by upwelling cold surface waters. Its temperatures are moderate, but during winter, they fall down to freezing points.
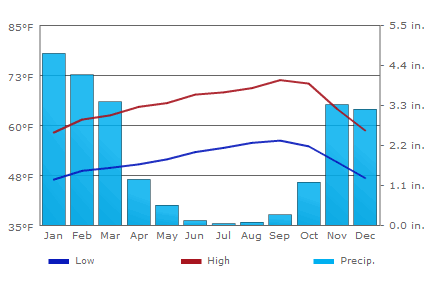
Its high temperature annually stands at 65.1 Fahrenheit and low at 51.4 Fahrenheit (See figure 2). Wang and Overland indicate that in a year, San Francisco has 67 rainy days and a precipitation average of 518.16. Besides, it has 105 cloudy days and 260 clear days in a year (45).
Figure 2: A climatograph showing temperature and precipitation averages for San Francisco
Climate control systems
The climate control for ocean currents in San Francisco has been set in place due to the fact that the movement of water in the Mediterranean influences climate changes (Stewart and Oke 922). In this city, ocean current control system has been set in all weather stations along the coast to check on the temperatures whether they make the city warmer or cooler.
It is important to mention that the moderate temperatures experienced at certain times in San Francisco are due to the southwest movement of ocean currents along the coast.
Bio-geography
Mediterranean climate zones vegetation have been considered to have a close association with scrub, woodlands and forest biome (Wang and Overland 46). San Francisco has a distinct climate which allows sclerophyll shrub-lands to thrive (Metcalf 444). These are mostly referred to as chaparral in California. Its natural vegetation has been adapted to survive over long period of times. Its vegetation comprises of herbs, grasses, shrubs, fruit trees, deciduous trees and evergreen trees.
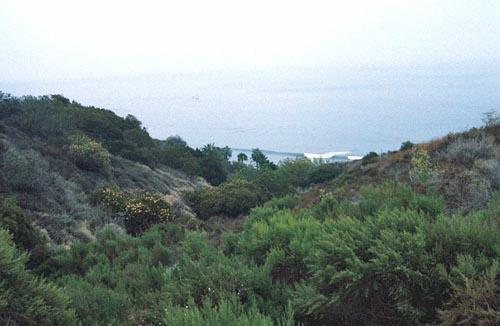
Figure 3: A figure showing a portion of San Francisco biome
Salt Lake city, Utah
Physical geographic description
Salt Lake City is the capital city of the state of Utah and has a population of approximately 186, 500 people. This city covers a geographical area of 285.9 square kilometers and its height above the sea level stands at 2,868 meters (Stewart and Oke 922). Salt Lake City has Grandview Peak as its highest point with 9410 feet of height and the areas near Great Salt Lake and Jordan River as the lowest points at 4210 feet.
The location of the city is towards the northeast of the Salt Lake. Its western and eastern borders are surrounded by steep Oquirrh and Wasatch mountain ranges. Marsh lands and mudflats form an extensive separation between the city and the Great Salt Lake. The outlay of the city follows a grid plan with streets running in all directions.
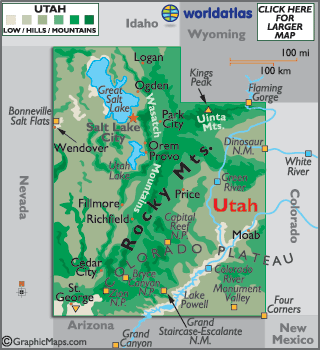
Figure 1: A figure showing the map of Salt Lake City, Utah
Climate and seasonal changes
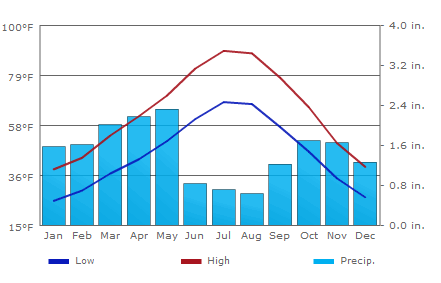
The Koppen climatic classification of the Salt Lake City (koppen BSk) is that it has four seasons in a year and is characteristically semi-arid. It has snowy and cold winters, and dry and hot summers. Both winter and summer in this city are long while its fall and spring are comfortable and brief. Its wettest season is during spring and the driest is the summer.
Precipitation averages and temperature changes
Pacific storms that come in the months of October through May have been considered to be the main source of precipitation in the city (Stewart and Oke 922). Cold storms from the Pacific Ocean cause measurable snow. Sometimes, during the storms, rains that are enhanced by the Great Salt Lake lead to the development of lake-effect snow.
These along with excessive snowfalls occur about eight times in a year. Besides, the temperatures during summer vary with 56 days of 90 Fahrenheit, 23 days with 35 degrees Celsius and 5 days with 37.8 degrees Celsius. Strong temperature inversions normally occur in areas like the Great Basin where pressure is high.
Figure 2: A figure showing precipitation averages and temperature changes in Salt Lake City, Utah
Climate control systems
Climate control systems in Salt Lake City use systems like pressure cells and storm tracks. The former is used because of the high pressure experienced in areas such as the Great Basin. Storm tracks are important control systems used to monitor storms coming from the Pacific Ocean into the city.
Bio-geography
The vegetation in Salt Lake City include sagebrush, creosote bush, desert spoon, prickly pear cactus, barrel cactus, suguaro cactus and yucca. This vegetation is attributed to the semi-arid characteristic of land due to the prevailing climate. Cacti are the major vegetation growing in large numbers with some portions of grasslands and prairies.
Works Cited
Haug, Katherine. “Bull v. city and county of San Francisco.” The Urban Lawyer, 43.2 (2011): 646-647. Print.
Jin, Menglin, and Marshall, Shepherd. “Inclusion of urban landscape in a climate model: How can Satellite Data Help?” Bulletin of the American Meteorological Society, 86.5 (2005): 681-689. Print.
Metcalf, Gabriel. “City for sale: The transformation of San Francisco.” Journal of the American Planning Association, 69.4 (2003): 444-445. Print.
Stewart, Iain and Timothy, Oke.”A new classification system for urban climate sites.” Bulletin of the American Meteorological Society, 90.7 (2009): 922-923. Print.
Wang, Muyin and James, Overland. “Detecting arctic climate change using Koppen climate classification.” Climatic Change, 67.1 (2004): 43-62. Print.