Introduction
Milk is the primary source of food for newborns and infants. The best and natural source of milk is from a lactating mother’s breast; hence, it is greatly recommended for newborns aged six years and below. Moreover, breastfeeding should be continued for approximately two years. Human milk is composed of several nutrients and minerals; nevertheless, a special diet may be recommended for infants in certain situations due to metabolic reasons or other pressing factors. As a result, in these cases, artificial feeding is embraced. Powdered milk contains nutrients and minerals, including trace elements. Examples of trace elements in infant milk formula are iron, lead, copper, manganese, cadmium, lead, and chromium.
The presence of metals in food is best determined by atomic absorption spectrometry (AAS), with the two main ones being the flame atomic absorption spectrometry (FAAS) and graphite furnace atomic absorption spectrometry (GFAS). In AAS, the flame vaporizes the sample and decomposes it into gaseous atoms. The concentration of individual atoms is then measured by the absorption of their specific wavelengths of radiation. For some metals, GFAS expresses superiority over FAAS and this is because each metal has its distinct absorbance wavelength. AAS is generally used to evaluate the concentration of an analyte in a sample. It requires the use of standards with known analyte concentrations to establish the association between the measured absorbance and the unknown analyte concentration. Therefore, entails the application of Beer-Lambert’s principle. This experiment aims to achieve the following objectives:
- To determine the amount of copper, one of the main trace elements, in an infant milk formula sample.
- To utilize serial dilution to generate a standard calibration curve.
- To evaluate the sensitivity of the GFAS using standard solutions.
Results and Discussion
In this experiment, the concentration of copper (Cu) in the infant milk formula was determined using the GFAS technique. Calibration standards were prepared from:
- Exact concentration of the stock copper = 602.4µg/ml
- Exact concentration of the working standard copper solutions = 24.1µg/ml
Four samples were obtained and absorption was measured using AAS. Before subjecting the sample to spectroscopy, the powdered milk sample was subjected to dry ashing (heating it in high temperatures of 600˚C in the furnace) and the wet digestion procedure (addition of concentrated nitric acid) to remove organic matter. The absorbance values of different samples are represented in Table 1 below.
Table 1: Sample solution preparation
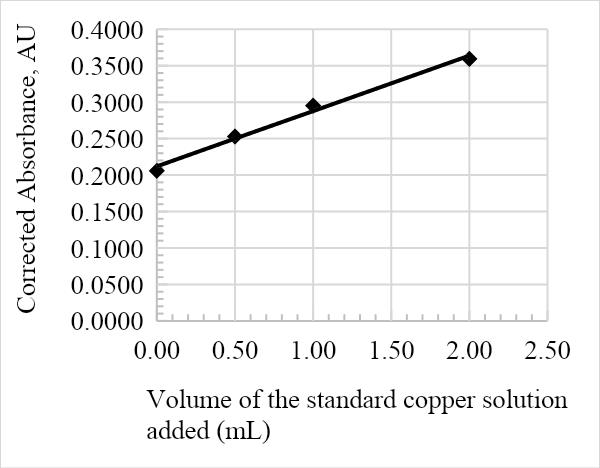
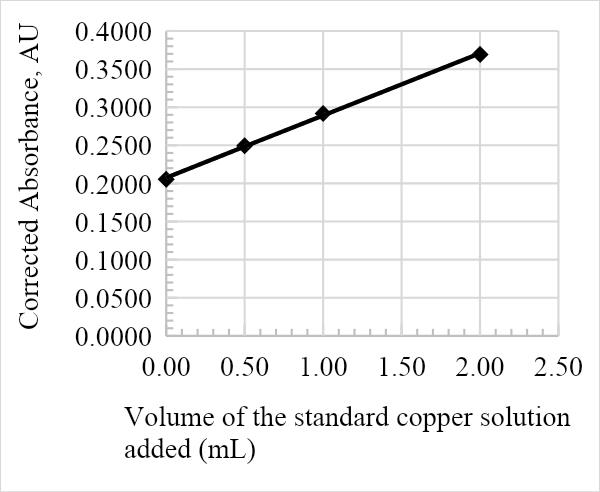
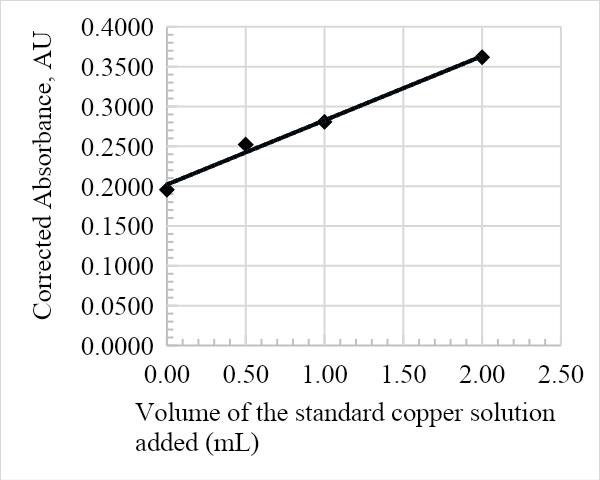
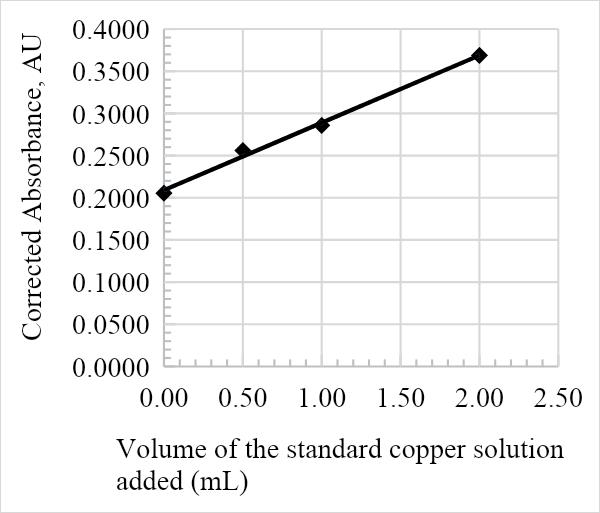
The absorbance against the volume of the standard Cu solution calibration graph was constructed from the results in table 1. The calibration curve is essential in determining the overall concentration of Cu in the infant milk formula, as is represented in the figures below. The graph adhered to Beer-Lambert’s law since the volume of the Cu solution added was directly proportional to the corrected absorbance, and as such is a useful analytical tool. Furthermore, the relatively high R2 values of 0.9905, 0.999, 0.9898, and 0.9948 for samples 1, 2, 3, and 4, respectively, suggest that the data is a good fit.
The average amount of Cu in the infant formula is determined by the value of the x-intercept on the calibration line. The following was calculated from the equations in Figures 1, 2, 3, and 4:
Table 2: Multiple increment standard addition analysis.
Based on Table 2 above, the average amount of Cu in the infant formula, which is the unknown, was 0.1151mgCu/100g. This amount is below the recommended daily amount of Cu intake in infants, which is 200 to 340 mcg (National Institute of Health, 2021).
The amount of Cu obtained had a percentage relative standard deviation of 16.63%. This low relative standard deviation suggests that the amount of Cu detected was closely scattered around the mean, therefore, suggesting minimal errors. Nevertheless, it is essential to recognize the existence of probable errors since the experiment has a relative error percentage of 2.17%.

The probable sources of error in the experiment might result from ashing altering the concentration of Cu in the powder due to volatilization. In addition, there might be contaminants present in reagents, water, or glassware that might interfere with the accuracy of the results. It is important to note that the blank was used to negate the effects of the contaminants on data interpretation.
Summary
The GFAS technique coupled with the multiple standard additions is effective in determining the concentration of copper in infant milk formula. The quality of the analytical method has been illustrated by the linearity of the calibration curve with correlation coefficients close to 1. Furthermore, the relatively small amount of Cu, 0.1151mgCu/100g, illustrates the superiority of the GFAS detection limits.
References
Lutfullah, G., Khan, A., Amjad, A., & Perveen, S. (2014). Comparative study of heavy metals in dried and fluid milk in Peshawar by atomic absorption spectrophotometry. The Scientific World Journal, 2014(715845), 1-5. Web.
National Institute of Health. (2021). Copper. Web.
Ziarati, P., Shirkhan, F., Mostafidi, M., & Zahedim M. (2018). An overview of the heavy metal concentration in milk and dairy products. ACTA Scientific Pharmaceutical Sciences, 2(7), 8-21. Web.


