Introduction
FDM Group is a London-based organisation that specialises in the provision of software and computer services to banks and other financial institutions. Two friends – Rod Flavell and Julian and Jaqueline Divett, started the company as an information technology (IT) organisation (RVY 2017). Today, its business model is centred on IT recruitment, where the company deploys its employees to their clients’ offices as consultants.
FDM’s market presence is visible in multiple cities around the world, including (but not limited to) Glasgow, Toronto, New York, Hong Kong and Leeds (FDM Group 2017). According to the company’s website, it has worked with more than 180 clients through partnership agreements that have seen the organisation recruit, train, deploy and build the human resource capacities of different firms (BFRS 2017). Within its business model, the organisation provides award-winning training to different groups of employees by imparting them with relevant digital development skills and technical expertise that would enable them to achieve their corporate goals (FDM Group 2017).
Many employees of FDK group are university graduates and ex-military personnel who are first trained in-house before they are allowed to work as consultants (BFRS 2017). Ex-professionals who want to come back also form a strong constituent of its employee base. The company’s business model focuses on using these three groups of people to work for the organisation as consultants. The prospective employees are usually trained for a minimum of 12 weeks, after which they sign a contract to work for the organisation (BFRS 2017). Financial institutions and banks are the main clients for FDM. Today, the organisation is listed on the London Stock Exchange and it is estimated to have a market capitalization of £981.63 million (FDM Group 2017). The firm is also listed as a member of the FTSE250 Index. However, it has plans to become a FTSE 100 organisation.
This report is a financial analysis of FDM Group. It is divided into two sections that analyse the company’s financial performance through quantitative and qualitative assessments. The first section details an analysis of the company’s financial performance using relevant financial ratios relating to the organisation’s operations in the last five financial years (2012, 2013, 2014, 2015, and 2016). The analysis includes an evaluation of the company’s profitability, investment returns, liquidity, key performance indicators (KPIs), net asset value, share price, and risk. The second section of the paper evaluates the company’s corporate governance standards and reviews how the same process influences its brand and reputation. The second section of the report also reviews the company’s medium-term financial, strategies to help it become a FTSE 100 organisation.
Profit Analysis
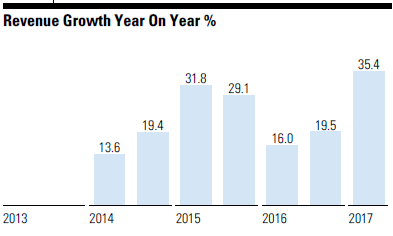
This section of the report will review FDM’s operations with the goal of understanding how it creates value for its shareholders through increased profitability. An assessment of the company’s profitability through an analysis of its return on assets (ROA) and return on equity (ROE) from 2012 to 2016 shows that it has remained profitable within the period under analysis. As evidenced in appendix 1, its ROA for the selected period were 31.80, 24.94, 33.81, 34.17, and 35.82 (Morningstar Inc. 2017). A 5-year average of the same numbers reveals that FDM’s ROA is 30.2 (Morning Star 2017). At the same time, the industry average is 6.7 and the country’s median ROA is 5.6 (Morning Star 2017). These figures show that FDM’s profitability is strong. The same narrative emerges through an assessment of its ROE because, in 2012, 2013, 2014, 2015, and 2016, the company reported figures of 63.37, 42.76, 48.44, 51.57, and 56.29 respectively. A 5-year average of the same number shows that its ROE is 53.2 (Morning Star 2017). The average ROE for the industry is 12.5, while the national ROE is 13.6 (Morning Star 2017). These numbers contribute to the strong profitability narrative that emerges in this section of the paper. The profit numbers mentioned above partly stem from the positive revenue growth the company has reported in the last five years. Figure 1 below shows that the IT-based organisation has boosted its revenues gradually from 2012 to 2016.

A quick review of the above graph reveals that the company has witnessed an increase in revenue growth from a low of 13.6% in 2014 to 35.4% in 2016. Through the increase in revenue, the company’s profitability has been appealing.
Investment Returns Analysis
An analysis of FDM’s return on invested capital showed that the company reported 45.23, 35.28, 48.61, 51.43, and 56.26 for the period under assessment (Morningstar Inc. 2017). These figures show that the company has been able to generate enough revenue for its investors because there has been a growth of the return on invested capital from 35.28 to 56.26 within the period.
Liquidity Analysis
An analysis of FDM’s liquidity draws attention to three liquidity ratios – current, quick, and debt-to-equity. A review of the current ratio shows that between 2012 and 2016, the company reported ratios of 2.03, 2.26, 2.11, 1.97, and 2.00 (see appendix 2). These estimates show that FDM is in a position to use its profits to meet its short-term and long-term financial obligations (Vickerstaff & Johal 2014). This view is premised on the fact that low current ratios indicate a company’s inability to pay for its liabilities (Magad & Amos 2013). Since FDM’s financial ratios are more than “1,” it is safe to assume that its assets could easily cover its liabilities (Vickerstaff & Johal 2014). An analysis of the quick ratio also supports the same view because, in 2012, 2013, 2014, 2015, and 2016, the company reported numbers of 1.75, 2.07, 1.96, 1.81, and 2.00 respectively (Morningstar Inc. 2017). These numbers mean that the company has a strong financial framework to meet its financial obligations (Denny 2013). Similarly, these statistics imply that the company enjoys a sound liquidity position (Morningstar Inc. 2017). The same view is supported by a review of the organisation’s debt-to-equity ratio because it is an average of 0.79. This finding supports the narrative that FDM has a strong liquidity position, relative to most of its competitors, which have reported different indexes lower than 0.79 (Morning Star 2017).
KPI Analysis
The main financial KPIs for FDM include Mountie revenue, adjusted operating profit, adjusted basic earnings per share, cash flow generated from operations, and adjusted cash conversion rate (FDM Group Holdings PLC 2017). A review of these five KPIs over the past five years demonstrates that FDM has performed best in increasing its Mountie revenue as the main KPI. The average increase within the period under assessment is 40% (FDM Group Holdings PLC 2017). This KPI comes from an increase in Mounties on client sites. The same phenomenon led to a significant increase in Mountie revenue growth. The constant currency had been 34% (FDM Group Holdings PLC 2017). The second best performing KPI has been the adjusted operating profit, which has averagely increased by 34% within the period under assessment. FDM Group managed to deliver an improvement in this KPI by increasing its Mountie numbers. This outcome was realised through an improvement of its operational capacity.
The third KPI under assessment is the adjusted basic earnings per share. From 2012 to 2016, the FDM Group has managed to improve on this indicator by 23% (FDM Group Holdings PLC 2017). The greatest improvement was reported in 2016. The progress has been supported by the organisation’s commitment to deliver its earnings growth in line with its corporate vision. The fourth KPI is the cash flow generated from operations. From 2012 to 2016, the company has increased this revenue by an average of 8% (FDM Group Holdings PLC 2017). In 2016, FDM closed the year with a cash balance of £27.8 million (FDM Group Holdings PLC 2017). This figure is an increase from the 2015 numbers of £22.4 million. The last KPI is the adjusted rate of cash conversion, which declined by an average of 14% within the period under assessment. This change is attributed to improvements in working capital management processes within the organisation, which have seen the company maintain it’s 2015 and 2016 capital management guidelines in 2017 and similarly aligned them with its corporate target of 100%. A summary of the KPIs appears in Table 1 below.
Table 1: KPI Performance.
Net Asset Value Analysis
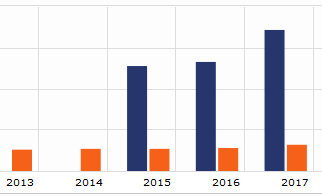
An overview of FDM’s net asset value will be undertaken through an analysis of the price/book ratio. Within the last five years, FDM has reported a figure of 17.2 (The Telegraph 2017). There is inconclusive information about the industry average, but a comparison of this figure with S&P’s 500 of 3.2 reveals that the company’s net asset value is sound. Figure 2 below reveals that the company’s share price, relative to its net asset value (using S&P measures) is impressive.

NB: The blue bar represents FDM’s performance while the orange bar reflects S&P’s index.
Share Price Analysis
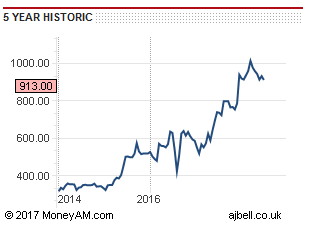
A review of FDM’s share price indicates the general performance of the company vis-a-vis investor perceptions. Today, one share of FDM sells for GBX 913. Experts project that this share price will increase throughout 2018 and beyond because they consider the price to be an undervaluation of the company’s performance (Market Beat 2017). Figure 3 below provides a general overview of the company’s price target history.

According to the graph above, FDM’s share price has largely increased over the last five years. Some analysts attribute it to effective management, while others say it is a product of good corporate management structures and policies (The Telegraph 2017).
Risk Analysis
Effective risk management is a critical component of FDM’s operational plans because it is integral to the achievement of the organisation’s goals. Financial risk is one among many risk profiles identified by the company’s management. The other categories include operational, strategic, and compliance risks (FDM Group Holdings PLC 2017). Risks that could have a significant impact on the company’s operations are categorised as “principal risks.” In its 2016 annual report, the board of FDM added risks that could have an impact on the company’s reputation as another category (FDM Group Holdings PLC 2017). In this report, a review of the key risks will be made to ascertain whether they have increased, decreased or remained constant within the period under review. Table 2 below shows a general assessment of FDM’s risks.
Table 2: Risk Assessment.
An increase in the risk associated with changes in the macroeconomic environment partly happened because there was increased instability in the economic environment. The results of the UK referendum and uncertainties in global markets during the year 2016 are largely to blame for this outcome. A review of operational risks attributed to the recruitment and selection of highly skilled workers for the organisation has remained unchanged because FDM’s board closely monitors recruitment standards. Similarly, the market for recruiting new professionals has remained unchanged. The latter scenario means that the company still has a broad base of talent from which to recruit new personnel. The unchanged nature of the operational risks highlighted above (Recruitment and development of highly skilled Mounties and the ability of the business to upscale) largely stems from the organisation’s firm grip on its human resource development plans, which have yielded a strong employee retention strategy characterised by the willingness of management to give its employees long-term share options. Nonetheless, generally, the company’s risk management profile is medium because they are either unchanged or have increased.
Corporate Governance Compliance Analysis
The board of directors and managers of FDM Group adhere to the highest standards of corporate governance. The framework currently followed in this respect is set out in the UK corporate governance code (the Financial Reporting Council issues it). The current framework followed by the company was published in 2014 and it complies with listing rules outlined by the Financial Reporting Council (FDM Group 2017). The strict adherence to these rules has had a positive impact on the organisation because investors and different stakeholders consider its corporate governance principles a positive addition to its management framework (FDM Group 2017). This positive reputation has partly contributed to the strengthening of the company’s share price and the strengthening of its business relationships with some of its partners. Particularly, the company’s adherence to disclosure and transparency rules, as stipulated by the Financial Conduct Authority, has assured many investors and the public that the company’s corporate governance practices are “aboveboard.” This positive corporate governance assessment is periodically proven in annual general meetings where the company’s management meets with its shareholders. Key aspects of its corporate governance philosophies are also interwoven with some of the organisation’s values, such as ambition and collaboration. Other values include energy, inclusivity, collaboration and growth (FDM Group 2017). The same values have strengthened the company’s image to its stakeholders because they have permeated throughout different cadres of its decision-making processes in the boardroom as well as different aspects of its activities.
Medium-term Financial Strategies to become a FTSE 100 Company
The key strategic focus of FDM to become a FTSE 100 company is centred on improving and developing its human capital and infrastructure. The company believes that by doing so, it would be able to create more value for its shareholders (FDM Group 2017). In line with this strategy, the IT firm opened four new academies in 2016. These facilities are situated in new locations while existing ones have been expanded to accommodate more people and provide more advanced training opportunities for new hires. Upgraded academies have been characterised by improved technological additions and enhanced branding. Current corporate strategies are aimed at further increasing specifications in the academies and improving corporate expertise in the same locations. These developments are mostly targeting in-house trainers because FDM wants to demonstrate to its shareholders that it is committed to improving the quality and breadth of its training.
Part of the company’s strategic focus is also centred on promoting a customer-led, profitable, and sustainable growth model that will guarantee all activities the company engages in provide the appropriate profit. Using this strategy, the organisation also expects to deliver sustained and measurable improvements for all its shareholders. Four key objectives would steer the organisation in this path: attracting, retaining and developing high-calibre Mounties, investing in leading-edge training academies, growth and diversification of client base and the expansion of geographic presence (FDM Group 2017). If these strategies are implemented effectively, FDM hopes to become a FTSE 100 Company.
Reference List
BFRS 2017, FDM Group Ltd. Web.
Denny, R 2013, Accounts for solicitors, 2nd edn, Routledge, London.
FDM Group 2017, Corporate governance. Web.
FDM Group Holdings PLC 2017, Annual report and accounts 2016. Web.
Magad, E & Amos, J 2013, Total materials management: the frontier for maximizing profit in the 1990s, Springer Science & Business Media, New York, NY.
Market Beat 2017, FDM Group stock price, news & analysis (LON: FDM). Web.
Morning Star 2017, FDM Group (holdings) PLC FDM. Web.
Morningstar, Inc. 2017, FDM Group (holdings) PLC. Web.
RVY 2017, FDM Group. Web.
The Telegraph 2017, ‘Fundamentals for FDM Group (holdings)’, The Telegraph. Web.
Vickerstaff, B & Johal, P 2014, Financial accounting, 2nd edn, Routledge, New York, NY.