Introduction
Growth in Information and Communications Technology (ICT) in both the 20th and 21st centuries has been phenomenal. Since the discovery of the computer and subsequent development of cyberspace, nearly every aspect of human life has been transformed.
It is now easier for people thousands of miles away to communicate instantly, people conduct business remotely without having to move between different locations and information travels faster than ever before. While there are numerous companies enabling the above ICT developments, two, Microsoft and Google have stood out in their respective fields.
Microsoft’s software enabled computers to run and its flagship web browser Internet Explorer was one of the premier products of the Internet era. Google on the other pioneered in internet search engine and advertising business with introduction of new applications that are still setting the trend in its respective field.
This discussion will focus on the two corporations with special emphasis on their financial positions as indicated by the latest financial ratios. Additionally, there will be a comparison between their models of business including their core business, products/ services, leadership styles, and innovation track record.
Business Model
Both companies have their origins in the US thus their business models is closely based on the American corporate system. Differences however stem from their core businesses and beliefs and vision of their founders and other leaders.
Initially, software development was Microsoft’s main business. However, Microsoft has since diversified its business and currently, the company has three divisions that together form its core business (Whney, 2006, p. 27). They include Microsoft Platform Products and Services Division, Microsoft Business Division, and Microsoft Entertainment and Devices Division.
Microsoft platform products and services division mainly deals with development of Windows operating systems including Windows XP and Windows Vista, server systems like Windows Server 2008, SQL Server, BizTalk Server and Small business servers, Developer tools e.g. Visual Studio 2010 and.NET Framework and, online services such as Messenger, Bing search engine and Windows Live.
The business division on the other hand deals in Microsoft Office suite which includes MS Word and MS Excel as well as other financial and business management software for companies. The entertainment division deals with numerous products including expansion of the Windows brand to Smartphone products and development and sale of computer games.
Google Inc. unlike Microsoft has its core business mainly in internet search, cloud computing, and online advertising (Duthel, 2008, p.90). Like Microsoft, Google’s core business falls into five categories relating to technology, especially the Internet. They include advertising, search engines, productivity tools enterprise products, and other products.
Google generates the bulk of its revenue from advertising same way Microsoft makes most of its revenues from Windows and Microsoft Office software. The main advertising avenue is the ad-sense program where Google helps companies to display targeted advertisements to specific web users. Google search engine is according market experts the most popular in the US and other parts of the world.
Microsoft’s Bing search engine is a direct competitor to Google but so far has underperformed. Like Microsoft, Google too has online products similar to Microsoft’s including a web browser-Google Chrome, and a free web-mail service Gmail.
In enterprise the company develops products such as Google Search Appliance which provides search technology to larger organizations. Besides, the above, Google also develops other services including Google Translate, Android phone operating system, and Google news (Scott, A. V. (2008, p. 7).
Both companies’ management styles differ greatly. Microsoft under Bill Gates adopted an executive style system where direction came from the top and all developments in the company had to have the founder’s approval.
Google on the other hand has in a place system that encourages individual work that helps employees develop products from hobbies and other activities of interest. According to Flamholtz & Randle (2011, p. 107), it is through this system that products such as Gmail, AdSense, Orkut, and Google News came into being.
As mentioned earlier, these two companies are pioneers in their respective fields as evidenced by their innovation and development track records. It is not easy to conclude with certainty which company has an upper hand when it comes to innovation. Microsoft has been around longer than Google and it has numerous products developed every year.
Google throughout its short history has achieved phenomenal growth and innovative products that continue to transform IT. Given that their fields are slightly different, it is fair to conclude that both corporations are innovative entities in their own right.
Financial Analysis
Financial analysis is one of the most accurate ways through which investors determine the health of a business. Financial ratio calculated from a company’s cash statement help in forecasting the business’s likely trend as dictated by economic cycles (Gibson, 2010, p. 49).
Current Ratio
The current ratio reveals a company’s liquidity or working capital position. Derivation of the current ratio is through dividing proportion of a company’s current assets by the current liabilities (Bull, 2007, p. 29). Through the current ratio, it is possible to determine if a company is able to use its short-term assets to pay off its short-term liabilities.
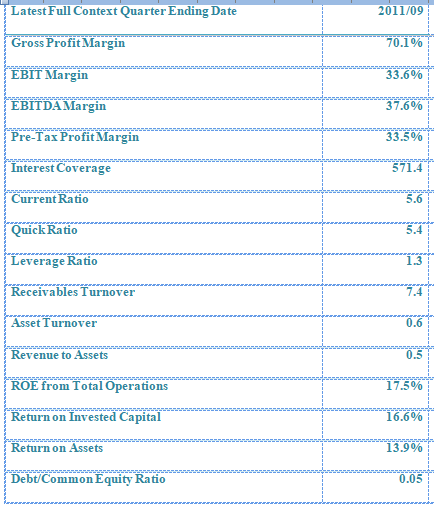
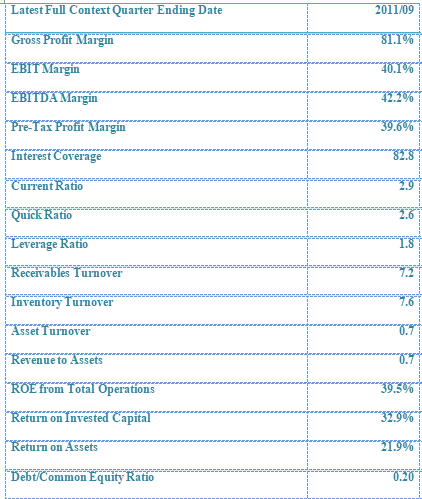
Though controversial, there is some consensus among economists that a higher current ratio is a healthy indication for business. Google’s current ratio as calculated from the 2011 financial statement stands at 5.6, while that of Microsoft stands at 2.9.
Credit Ratios – GOOGLE INC-CL A (GOOG)
Credit Ratios – Microsoft Corp (MSFT)
In theory therefore, Google is on better financial shape to pay off for its short-term liabilities compared to Microsoft. However, it is important to note that despite high current ratio figures, what matters is ability of a company to convert its working capital assets into cash to meet its liquidity needs.
Return on Assets
Return on assets (ROA) indicates profitability of a company (Bull, 2007, p. 33). By comparing a business’s net income to average total assets, analysis can tell if a management is implementing sound financial policies in managing the company’s assets in order to make a profit. The ROA is expressed in percentage. Google’s ROA stands at 13.9% while that of Microsoft is at 21.9%.
Profitability – GOOGLE INC-CL A (GOOG)
Profitability – Microsoft Corp (MSFT)
Considering both companies dwell on the technology sector, their ROA’s should experience minimal variations. However, the difference highlighted by the figures above points to an efficient management at Microsoft hence a high return of profits through use of the company’s assets.
Return on Equity
Like return on assets, return on equity too helps in determining a company’s profitability through comparison of its net income with the average equity of shareholders (Gibson, 2010, p. 74). More importantly, the ROE helps indicate the average earning per investor according to their investment in the company.
Like current ratio, a higher ROE is indication of sound management of shareholders’ equity thus better returns for investors. Google’s ROE from total operations stands at 17.5% while that of Microsoft stands at 39.5%. Microsoft once again posts a superior profitability indicator compared to Google.
In a dual comparison, investors are likely to put their money in Microsoft because of the likelihood of high average per-share earnings.
Debt Ratio
The debt ratio puts into perspective a company’s leverage by dividing a company’s total debt with its total assets. A high debt ratio percentage is not a healthy indicator since the business is most likely depending on leverage (Gibson, 2010, p. 85).
Google’s debt ratio is 0.05% while that of Microsoft is 0.20%, a big figure compared to Google’s. It is therefore likely that Microsoft depends more on borrowed or lent money than Google.


Fixed Asset Turnover Ratio
Analysts use this ratio to determine productivity of a company’s fixed assets through sales generated. Like most ratios above, a high fixed asset turnover ratio points to sound management of business assets (Bull, 2007, p. 38).
Google’s fixed asset turnover is 4.9% while that of Microsoft is 9.0%, nearly double that if its competitor. Compared to Google, Microsoft has had a long time to develop its assets and asset management expertise hence the superior ratio.
Asset Turnover – GOOGLE INC-CL A (GOOG)
Asset Turnover – Microsoft Corp (MSFT)
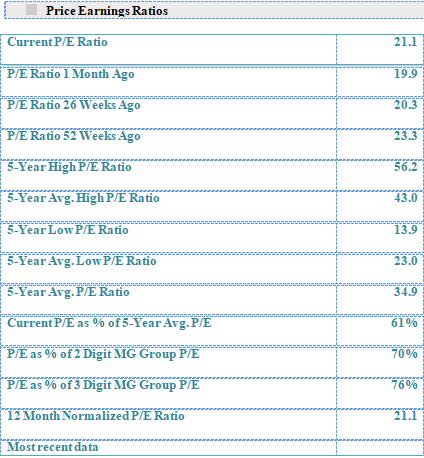
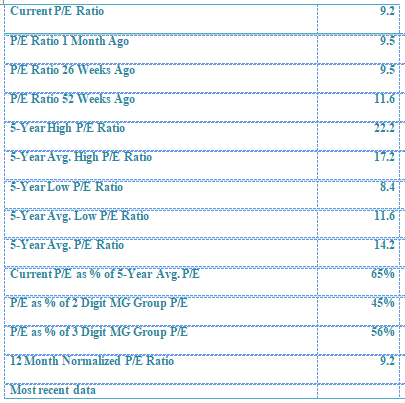
Price Earnings Ratio
Dividing a company’s stock per price by earnings per share will give the P/E. a high P/E ratio suggests optimism about a company’s future in comparison with the overall market (Gibson, 2010, p. 81). Google’s current P/E is 21.1 while that of Microsoft is 9.2. The above figures suggest that investors are more confident about Google’s future prospects than Microsoft’s.


Best Prepared Company
From the ratios above, Microsoft appears as being in a stronger position compared to Google. In a worst-case scenario like a recession, there is little credit flow from banks and consumers minimize spending.
Microsoft is likely to suffer most because its dependence on leverage is higher than that of Google additionally, Microsoft deals in software products that are likely to suffer compared to Google’s when consumers hold back on spending. Google therefore is better able to withstand a recession since advertising and search engine activities are likely to experience minimal effects.
Despite Microsoft’s slight dependence on leverage, it still is the stronger of the two companies in terms of fixed asset turnover ratio, return on equity, and return on assets. Investors will therefore be inclined to invest in Microsoft regardless of the negative sentiment as evidenced in the price-earnings ratio.
It is important however to note that those investing in Microsoft will likely be short-term investors who will be seeking to cash in on the firm’s profitability. In the long term, more investors are likely to invest in Google because of its positive long-term outlook.
Investment Decisions
When investing, especially in technology-oriented companies, the most important aspect to consider will be the innovativeness of the entity. However, financials especially profitability does matter too (Tyson, 2005, p. 60).
some of the guidelines that will be crucial in investors determining which of the two companies is worth investing in include profitability as demonstrated by a high ROE, ability to pay both its short-term and long-term liabilities, and the price-earnings ratio.
Through the above factors, investors will be in a better position to gauge the likelihood of gaining from his equity both in the short and long term. Also, it will help him/her to assess stability of the company both in the short and long runs (McMillan, 2002, p. 87).
Conclusion
Despite the differences in the figures shown under financial analysis, it is important to note that both companies have solid short and long-term stability perspectives.
They both thrive on innovation and their financial positions are strong. Like most technology companies, they are likely to wither the effects of economic cycles like the 2008 financial crisis and the resultant recession. Therefore, it will make perfect business sense for any investor to make a venture into the two technology leaders.
References
Bull, R. (2007). Financial ratios: how to use financial ratios to maximize value in Business. Berlin: Springer Verlag.
Duthel, H. (2008). Google Inc. Services – Google Tools – What is Google? New York: Cengage Learning.
Flamholtz, E. & Randle, Y. (2011). Corporate Culture: The Ultimate Strategic Asset. London: Sage Publishers.
Gibson, H. C. (2010). Financial Reporting & Analysis: Using Financial Accounting Information. London: Sage Publications.
Hilderbrand, C.B. (2007). WindowsMedia – The Role of Microsoft Corporation in the Current IT and Business World. New York: Routledge.
McMillan, G.L. (2002). Profit with options: essential methods for investing success. New York: Routledge.
Scott, A. V. (2008). Google. New York: McGraw Hill.
Tyson, E.K. (2005). Investing for Dummies. New York: John Wiley & Sons.
Whney, M. (2006). Microsoft Corporation: branding and positioning.Net. Chicago: Thomsons Learning.