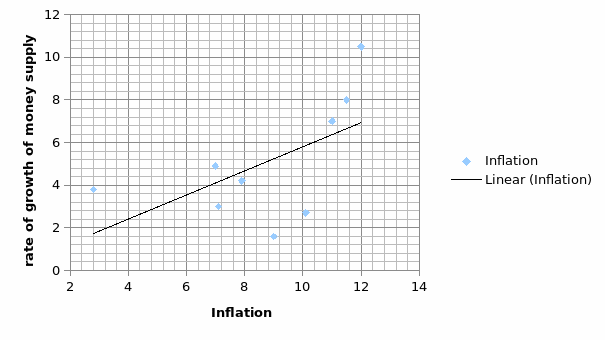
The rate of increase in the money supply and inflation
The data support a connection between the ate of increase in the money supply and inflation because the regression and correlation coefficients show that the two variables are related. There is a positive relationship between the two variables. The scatter plot shows that the line of best fit has a positive direction. In addition, the two variables are related because it is possible to develop a graph of the data collected.

Using the data on the growth rate of Money and inflation, run a regression of the rate of inflation on the rate of growth of the money supply. Use Excel Data Analysis.
A regression line equation for the the rate of growth of the money supply compared to inflation is; Y = 0.57446X + 0.571. The regression equation shows that the slope of the line is 0.57446 and the y-intercept is 0.571. Therefore, when there is no inflation (0% inflation rate), the rate of economic growth is 0.571. This is indicated by the y-intercept. The gradient of the rate of change of the money supply relative to change in inflation.
Interpret slope
The slope of the regression line is 0.57446. This means that when the inflation rate changes by 1%, the rate of growth of the money supply changes by 0.57446%. The coefficient on the money supply variable suggests that there is a positive relationship between inflation rate and the rate of growth of the money supply.
Forecast inflation if money = 8
Inflation is the independent variable (x) whereas the rate of change of the money supply is the dependent variable (Y). Therefore,
Y = 0.57446X + 0.571
8 = 0.5744X + 0.5718
7.429 = 0.57446X
X = 12.93
Inflation is 12.93%
P-value and the regression coefficient
The p-value indicates the probability that a certain event will occur. The p-value indicates the rejection region when testing the hypothesis. Points that lie below the p-value are accepted while the points that exceed the p-value are rejected (Mendenhall, Beaver & Beaver, 2009).
The analysis was conducted at 5 level of significance, therefore, the rejection point is 0.05. The regression coefficient (0.571) is significant, because the p-value (0.108) is greater than 0.05 (p >0.05).
Interpret the coefficient of determination
The coefficient of determination is used in identifying how fit the regression line is in a given data set. The coefficient of determination is 0.326, and this indicates that the regression line is relatively bad. The coefficient of determination shows that the variation in the regression is 32.6% explained by the inflation. This is a bad regression because the coefficient of determination is small.
Is faster money growth always associated with higher inflation?
Faster money growth is associated with higher inflation. There is a correlation of 0.57087 between the inflation and the rate of growth of money.
Reference
Mendenhall, W., Beaver, R. J., & Beaver, B. M. (2009). Introduction to probability and statistics. Belmont, CA: Brooks/Cole.