Non-Citizen Population Estimates by Age Group and Gender Report

Exclusively available on IvyPanda Available only on IvyPanda

The data below represents population estimates by age group and gender of non–citizens. The data was obtained from the official website of the Abu Dhabi Statistics Centre. The data is quantitative since it is numerical but it has been grouped. The groups are in class intervals of four with the first group having the interval 0-4 years and the last group being above 80 years.

We will write a custom essay on your topic a custom Report on Non-Citizen Population Estimates by Age Group and Gender
808 writers online

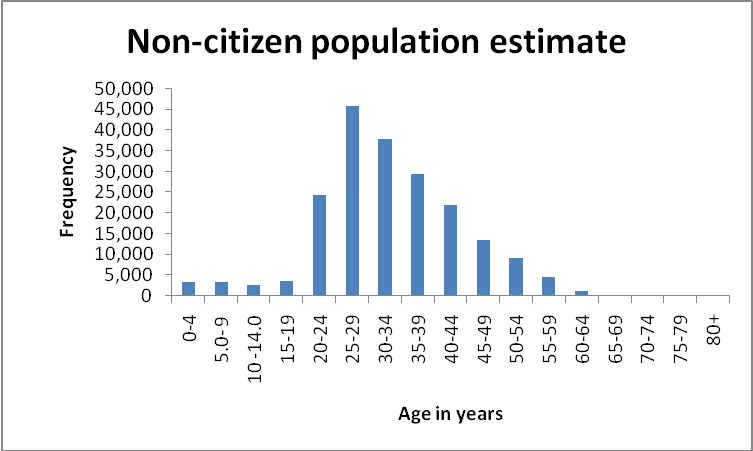
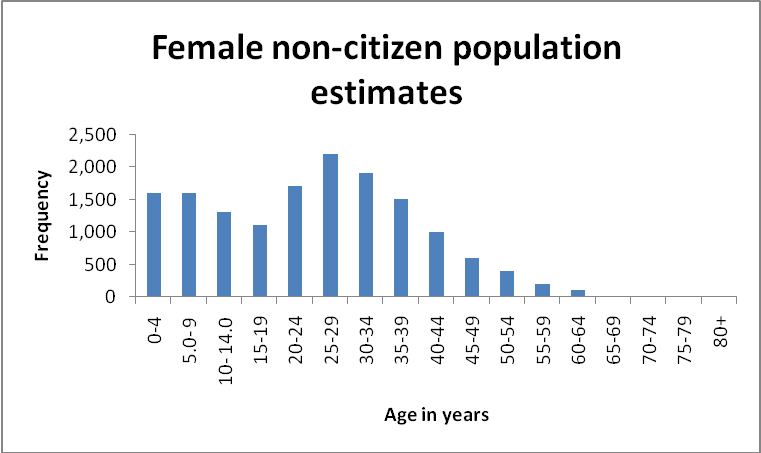
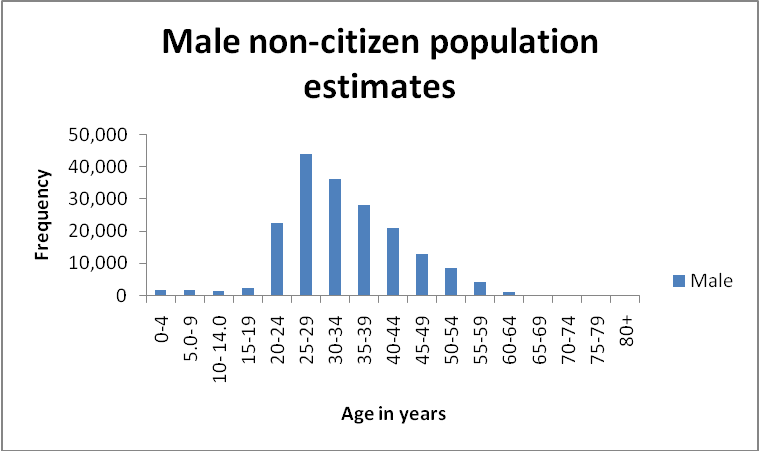
From our analysis, the mean age for both males and females is 33 years with the mode being 27 years and the median class was 30-34 years. The majority of the non-citizens were male while the female population stood at 7.6% of the total. Most of the female population was in the 20-24, 25-29 and 30-34 age brackets. A significant number of the female population was also in the 0-4 and 5-9 age groups. Meanwhile, the majority of the male population was found in the 25-29, 30-34 and 35-39 age brackets. Only 100 females were above 60 years but none was above 65 years. On the other hand, there were 1,100 males in the 60-64 years age group and 200 males in the 65-69 age groups.

As seen in the histograms below, the general population (both male and female) is skewed to the left (negative skew). This skew is influenced by the male population as it the more than the female population. The same outlook is observed on the male non-citizen population histogram. As for the female population, the histogram is skewed to the right (positive skew).
Age groupMidpointfrequencyMidpoint*frequencyPercent of total frequency
0-423,3006,6001.6%
5-973,30023,1001.6%
10-14122,60031,2001.3%
15-19173,50059,5001.7%
20-242224,300534,60012.1%
25-292746,0001,242,00022.9%
30-343238,0001,216,00018.9%
35-393729,4001,087,80014.6%
40-444222,000924,00010.9%
45-494713,600639,2006.8%
50-54529,100473,2004.5%
55-59574,500256,5002.2%
60-64621,20074,4000.6%
65-6967200134000.1%
70-7472072000%
75-7977000%
80+000%
Total201,0006,588,700100%
Mean33years
mode25-29years
Median30-34years

Female non-citizen population estimates

Male non-citizen population estimates

Non-citizen population estimate

Age groupMaleFemalePercent of total male populationPercent of total female population
0-41,7001,6000.9%10.6%
5.0- 91,7001,6000.9%10.5%
10- 14.01,3001,3000.7%8.6%
15-192,4001,1001.3%7.2%
20-2422,6001,70012.2%11.2%
25-2943,8002,20023.6%14.5%
30-3436,1001,90019.4%12.5%
35-3927,9001,50015.0%9.9%
40-4421,0001,00011.3%6.6%
45-4913,0006007.0%3.9%
50-548,7004004.7%2.6%
55-594,3002002.3%1.3%
60-641,1001000.6%0.7%
65-6920000.1%0.0%
70-74000%0.0%
75-79000%0.0%
80+000%0.0%
Total185,80015,200100.0%100%

Reference

National Statistics Center of Abu Dhabi. (2011). Non- Citizen Population Estimates by Age Group and Gender. Web.

1 hour!
The minimum time our certified writers need to deliver a 100% original paper
Print
Need an custom research paper on Non-Citizen Population Estimates by Age Group and Gender written from scratch by a professional specifically for you?
808 writers online
Cite This paper
Select a referencing style:

Reference

IvyPanda. (2022, May 10). Non-Citizen Population Estimates by Age Group and Gender. https://ivypanda.com/essays/non-citizen-population-estimates-by-age-group-and-gender/

Work Cited

"Non-Citizen Population Estimates by Age Group and Gender." IvyPanda, 10 May 2022, ivypanda.com/essays/non-citizen-population-estimates-by-age-group-and-gender/.

References

IvyPanda. (2022) 'Non-Citizen Population Estimates by Age Group and Gender'. 10 May.

References

IvyPanda. 2022. "Non-Citizen Population Estimates by Age Group and Gender." May 10, 2022. https://ivypanda.com/essays/non-citizen-population-estimates-by-age-group-and-gender/.

1. IvyPanda. "Non-Citizen Population Estimates by Age Group and Gender." May 10, 2022. https://ivypanda.com/essays/non-citizen-population-estimates-by-age-group-and-gender/.


Bibliography


IvyPanda. "Non-Citizen Population Estimates by Age Group and Gender." May 10, 2022. https://ivypanda.com/essays/non-citizen-population-estimates-by-age-group-and-gender/.

Powered by CiteTotal, free referencing generator
If you are the copyright owner of this paper and no longer wish to have your work published on IvyPanda. Request the removal
More related papers
Cite
Print
1 / 1