Introduction: Materials and Methods
Cell Culture
Human cervical epithelial cancer cells (CXT2) will be cultured in Keratinocyte Serum-Free Media (KSFM, GIBCO) with growth factors: bovine pituitary extract (BPE) and epidermal growth factor (EGF). Cells will be grown on 60 mm plastic culture dishes for incubation (at 37°C, 5% CO2), and they will be periodically passaged every 3-4 days using 0.05% Trypsin/EDTA (Life Technologies [Thermo Fisher]). The Trypsin will be neutralized using KSFM with 10% Fetal Bovine Serum (FBS) and removed through centrifuging at 600 rpm for 5 minutes, after which cells will be resuspended in KSFM complete media. Cell count will be determined by making a dilution of 10 μL of suspended cells in 90 μL of Trypan Blue (Sigma-Aldrich), pipetting approximately 50 μL of this solution onto a hemocytometer and counting the number of live cells. Cells prepared for imaging will be grown on 35 mm plastic culture dishes, while cells prepared for incubation will be plated on 60 mm plastic culture dishes.
Fluorescent Staining
Cells will be stained with calcein and fluorescent PA to study the PA localization on cells. 20,000 cells will be plated on 12 mm glass coverslips and incubated overnight for cells to attach and spread. Fluorescent PA solution will be prepared by adding 2% (w/w) of fluorescent PA analog to non-fluorescent PA and putting them on culture media at a final concentration of 30 µM.
Rhodamine 123
Cells will be removed from incubation after growth on a 35 mm imaging plate. A dilution of Rhodium 123 will be done by pipetting 1 μL of dye into 1 mL of KSFM complete. Media from the cells will be removed and replaced with the fluorescent dilution media and incubated for 45 minutes. The fluorescent media solution will be replaced with fresh KSFM complete media prior to imaging.
Calcein
Cells will be removed from incubation after growth on a 35 mm imaging plate. A 2000x dilution of calcein-AM will be made by adding 0.5 μL of dye into 1 mL of KSFM complete media. Media from the cells will be removed and replaced with the fluorescent dilution media and incubated for 25 minutes. The media will be replaced with 1 mL of KSFM complete media prior to imaging.
Propidium Iodide
Immediately before imaging, the media of incubated dishes will be replaced with a 200x dilution of propidium iodide (PI) made by mixing 5 μL of dye with 1 mL of KSFM complete. The same concentration of PI will be added to each solution of PA prior to media replacement during imaging.
Cell Viability Assay
Cell viability assay will be performed by staining cells with ToPro-3 dye (ThermoFisher) that stains the nucleus of dead cells with the compromised plasma membrane. Cells will be seeded on a 96 well plate at a density of 5,000 cells/well in 100 µL of KSFM media. After overnight incubation, PA and ToPro-3, dissolved in 10 µL of sterile milliQ water, will be added to the media to achieve desired final PA concentration for treatment and 2 µM ToPro-3. Bright-field and fluorescent images of the cells in wells will be acquired using a MiniMax 300 Imaging Cytometer attached to a Spectramax i3x Microplate reader (Molecular Devices). Image acquisition will be started immediately after the addition of PA and performed for up to 6 h at predetermined time points while keeping the plate inside an incubator at 37 oC in between the imaging events. Cells will be counted from a rectangular region of interest within the wells using the object analysis tool of the SoftMax Pro 6 software. For bright-field images, automated cell counts will be compensated with manual correction. Bright-field images of the first time point will be used for total cell count, while ToPro-3 positive cells at different time-points will be utilized to estimate the dead cell numbers.
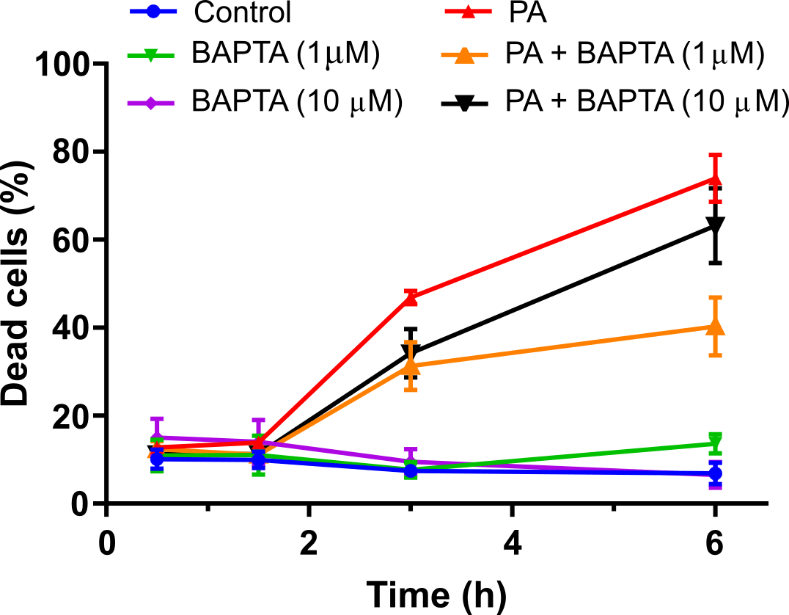
To assess the viability response to PA for BAPTA-treated cells, a similar procedure will be followed, except the cells will be pretreated with cell-permeant BAPTA-AM at a concentration of 1 µM or 10 µM, for 30 min at 37 oC. Following the incubation in BAPTA-AM the media will be replaced with fresh KSFM media prior to the addition of PA.
Confocal Microscopy
Confocal Microscopy (for PA-cell membrane interactions)
CXT2 cells will be seeded onto 12 mm glass coverslips containing a PA coating, placed in a 24-well plate. For visualization, the PA solution with 1 wt% of a fluorescent analog will be used. Cells will be harvested and labeled by incubation with a 1 μM solution of DiO or DiI in KSFM, at 37°C for 30 minutes. After this incubation, cells will be washed in KSFM twice and centrifuged at 600 rcf for 5 minutes to remove the wash solutions. After the washes, cells will be resuspended with KSFM to 300 cells/uL, and 50 uL of this solution (15,000 cells) will be deposited onto the coverslips. To allow cell attachment without disturbance, glass coverslips will be incubated with this 50 uL cell suspension for 1 hour before more KSFM will be added to fill the well. Cells will be incubated with the PA coatings for a total of 4 hours and then fixed using 4% paraformaldehyde (PFA) for 15 minutes at room temperature.
Following PFA fixation, samples will be washed 3x with PBS, and the coverslips will be mounted onto glass slides. One day after mounting, images will be observed using the 63x objective on a Leica DMI8 confocal microscope, and Z-stacks will be taken to capture the focal planes shown in Figure1-4a.
Calcium Imaging
Cells will be observed using a Nikon TE200 epifluorescence microscope. The cells will be placed onto glass coverslips at low density, and these will be moved into a perfusion bath on the microscope stage. The perfusion bath contained a solution of 10 mM HEPES, 2.5 mM KCl, 1.8 mM Ca+2, and 1 mM MgCl2. Cells will be washed with this solution alone after 1 minute and then washed with experiment-specific solutions at 3 minutes and 5 minutes. The experimental solutions included a zero calcium solution, which contained the same concentrations of all other solutes but lacked any calcium ions, a zero calcium solution with the presence of 30 μM PA in solution, and the standard solution with the addition of 30 μM PA in solution.
Before imaging, cells will be loaded with Fluo-4 (AM) (Life Technologies [Thermo Fisher]) for 30 minutes at 22 degrees Celsius. The cells will be washed and incubated afterward at 37 degrees Celsius. The resulting fluorescence as imaged in the camera system will be studied through a 488 nm excitation and 510 nm emission filter, with 0.5 frames imaged per second at an exposure of 200 ms. All trials will be performed for a total time of 25 minutes.
The coverslip will be transferred to a new well containing one of the following solutions (1 mL): (i) BAPTA/AM Coverslips will be incubated for 30 min at 37°C, and then transferred to an inverted phase-contrast microscope. Fresh test agent solution or vehicle control solution will be added to the coverslip chamber, and data acquisition will be initiated (data collected at 5-s intervals throughout the experiment). Baseline [Ca2+]i will be determined for 150 s immediately prior to the addition of PA. Once the baseline is established, PA (20 lL from solutions of various dilution) will be added to achieve final PA concentrations of 200, 400, or 800 mg/dL in the dose-response experiment, while 400 mg/dL will be utilized in all other Ca2+ imaging experiments.
The microscope will remain focused on this view-filled for the duration (30 min) of the experiment. Every 5 s, the [Ca2+]i will be determined for each cell in this view-field. On average, approximately forty cells per coverslip (range of 15 to 50 cells) will be analyzed. A mean [Ca2+]i will be calculated from the cell data for each 5-s time point. In most experiments, cells from several replicates of the experiment will be pooled to increase the accuracy of [Ca2+]i calculations. In our experiments, cultures will be established from a single mouse litter and will be made to constitute one experimental replicate. To verify this analysis procedure, instead of pooling cells across replicates, the cells will be pooled within an experimental replicate.
Time-lapse Imaging
Time-lapse images of fluorescently stained cell samples will be obtained with a monochrome CCD camera (Nikon Biostation IM-Q) and a fluorescence lamp (Nikon Intensilight C-HGFIE). The magnification for each time-lapse set will be set at 10x, with an acquisition rate of one image every 5 minutes for vitality experiments and a rate of one image per minute for mitochondrial response experiments. Images will be exported and studied in Fiji for ImageJ (NIH), using the TrackMate plugin to establish and export individual cell statistics. In TrackMate, all image sequences will be first analyzed with the Laplacian of Gaussian (LoG) Detector with sequence-specific approximate cell diameter and threshold value input manually. For long imaging sets meant to study population behaviors and hierarchies, the Linear Assignment Problem (LAP) tracker will be used with a manually input 25-micron distance for max frame linking, a 25-micron distance, and frame depth of 10 for maximum gap closing, and a 15-micron distance for track splitting. For shorter imaging sets or imaging sets, which involved a total frameshift due to PA addition, the simple LAP tracker will be used. For those that only involved frame linking and gap closing, the previous values will be utilized. The data output by TrackMate analysis will be separated by track or by spot with desired related data. This information will be then inputted into Prism 5 for graph output and for further statistical analysis.
Image Analysis
Time-lapse imaging of cells at a magnification of 40x or 20x will be used for measuring the area of cell nuclei before and after death. Images will be placed into ImageJ and the nuclear circumference will be selected manually. The software will be used to calculate the area of the selection and output it into an excel file. This process will be repeated for the first and last image in each time-lapse sequence for each cell with an identifiable nuclear membrane. The measurements of before and after will be organized in an excel file, the difference between them will be calculated, and the percent decrease will be evaluated. This percent decrease will be combined into box-and-whisker plots and significance calculated between the control and the non-inhibitor set and between the non-inhibitor set and the inhibitor set.
For the PA-free culture groups, KSFM will replace the PA. The following agents will be tested individually for their effectiveness in preventing PA-induced neuronal death. BAPTA acetoxym-ethyl ester (BAPTA/AM, a membrane-permeable Ca2+ chelator) will be dissolved initially in DMSO, and vehicle control groups will receive identical DMSO exposure (0.003% for BAPTA/AM). Solutions containing either a test agent or a vehicle control will be added directly to the culture media utilizing two experimental protocols. With the pre-treatment paradigm, the test agent or the matching vehicle control will be added 30-min prior to PA addition.
Results and Discussion
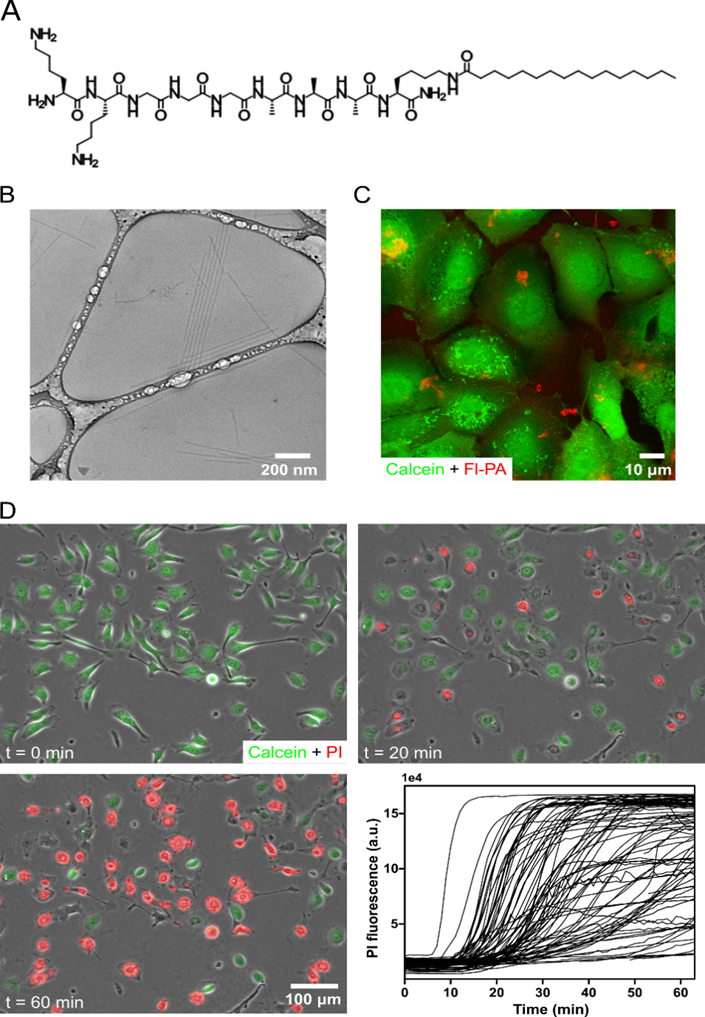
In this work, we seek to synthesize a PA containing the peptide sequence K2G3A3, which has weak propensity for ß-sheet formation, conjugated to a C16 hydrophobic tail via a lysine linker (Figure 1A). Due to self-assembly enabled hydrophobic collapse and peptide hydrogen bonds, this PA would form anisotropic nanofibers when dissolved in aqueous media (Figure 1B). Previous work shows that this PA could enhance BMP-2-mediated osteogenic differentiation in C2C12 mouse myoblasts by interacting with the cell membrane and increasing lipid raft mobility [20]. This ability to affect the lipid raft could be attributable to its weak ß-sheet formation, as an analogous PA with a strong ß-sheet forming peptide sequence may not enhance osteogenic signaling. This proposal holds that an increased lipid raft mobility and the enhanced osteogenic signal would be apparent when cells are treated with 10 μM PA, a concentration that could potentially allow cell viability over the experimental period. However, the study predicts that the treatment of cells with a higher concentration of 50 μM PA would cause significant cell toxicity. In the current work, we see to analyze the cytotoxic response of CXT2 cancer cells to this PA.
We expect to observe the interaction of the PA with CXT2 cells by mixing a small amount (2%) of fluorescent PA with the PA, treating the cells with this mixture, and observing the cells using confocal microscopy. After a one-hour incubation, visualization of cells with calcein would allow the taking of confocal micrographs. The observation of fluorescent PA associated with the surface of the cells would suggest that the PA could interact with the membranes of the CXT2 cells (Figure 1C). To study if this interaction would lead to cell death, cells would be stained with calcein, added propidium iodide to the media (PI), and then treated with 30 μM PA. Results of time-lapse imaging should depict the release of calcein, display uptake propidium iodide, and show if cells undergo cell death. The setup expects cells to release calcein after an average of 20 minutes, after which the signal would completely diminish within one hour (Figure 1D). The addition of PA would cause cells to begin to uptake PI after about 20 minutes, but some cells would not be able to uptake PI even after 60 minutes (Figure 1D). For calcein to diffuse out of the cell and PI to diffuse into the nucleus, the cell membrane structure ought to be in a compromised state. Thus, this time-lapse experiment suggests that the cell death mechanism may involve the compromise of the cell membrane.
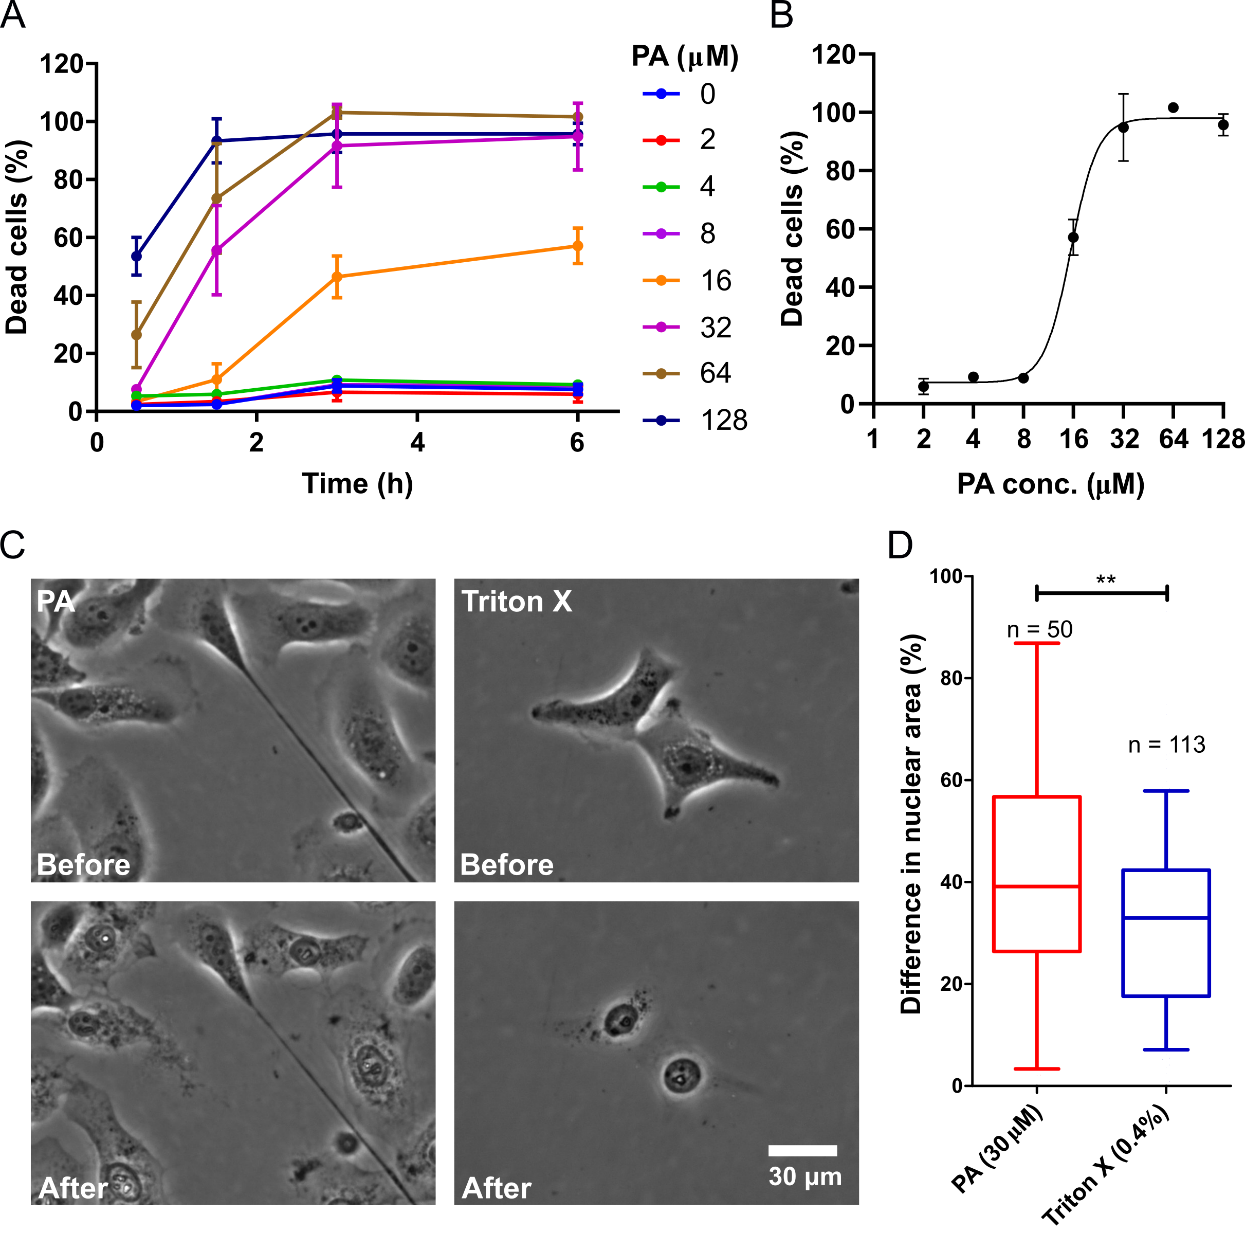
The observation of the cytotoxicity at 30 uM would lead to testing of test other PA concentrations. Based on previous work, the study expects that lower concentrations can enhance lipid raft signaling without causing cell death. In this view, the study would culture the cells in 96 well plates, expose the cells to different concentrations of PA in the cell media, and measure the cytotoxicity by propidium iodide uptake. Figure 2A shows the concentrations of 2-128 uM of PA, at different time points up to 6 hours, which would cause the cytotoxic effect. Below and including 8 µM PA, there would be a little cytotoxicity above the no PA control (Figure 2A). At 16 µM PA, cell death initially would not occur above the control; however, after three hours, the percent of dead cells would be about 46.4% and increase to 57.1% after six hours. At the higher PA concentrations of 32, 64, and 128 uM, cell death may occur much more rapidly (Figure 2A). Specifically, at 128 uM PA, a high proportion of dead cells would occur after only 30 minutes of treatment (Figure 2A). By plotting the cell death response at six hours and fitting a concentration-response curve, the study expects to have an IC50 to be 15.7 uM (Figure 2B).
Interestingly, the study may indicate a shrinkage in the nuclear area of cells dying from PA treatment. Further exploration would require treatment of CXT2 cells with 30 uM PA and imaging them as they undergo cell death, using phase-contrast microscopy. To study if nuclear shrinkage is a characteristic of cell membrane disruption, the cells would be treated cells with Triton X (0.04% w/v), a known detergent that lyses cells. The measurement of the nuclear area before and after cell death would occur following treatment with either PA or Triton X. Cells treated with Triton X would show a mean decrease of 32% in the nuclear area, while those treated with PA would indicate a mean decrease of 42% (Figure 2C-D, p < 0.05). This result may suggest that, while PA likely induces cell death by disrupting the membrane, the cytotoxic mechanism is different from that of detergents like Triton X.
Mitochondrial Depolarization
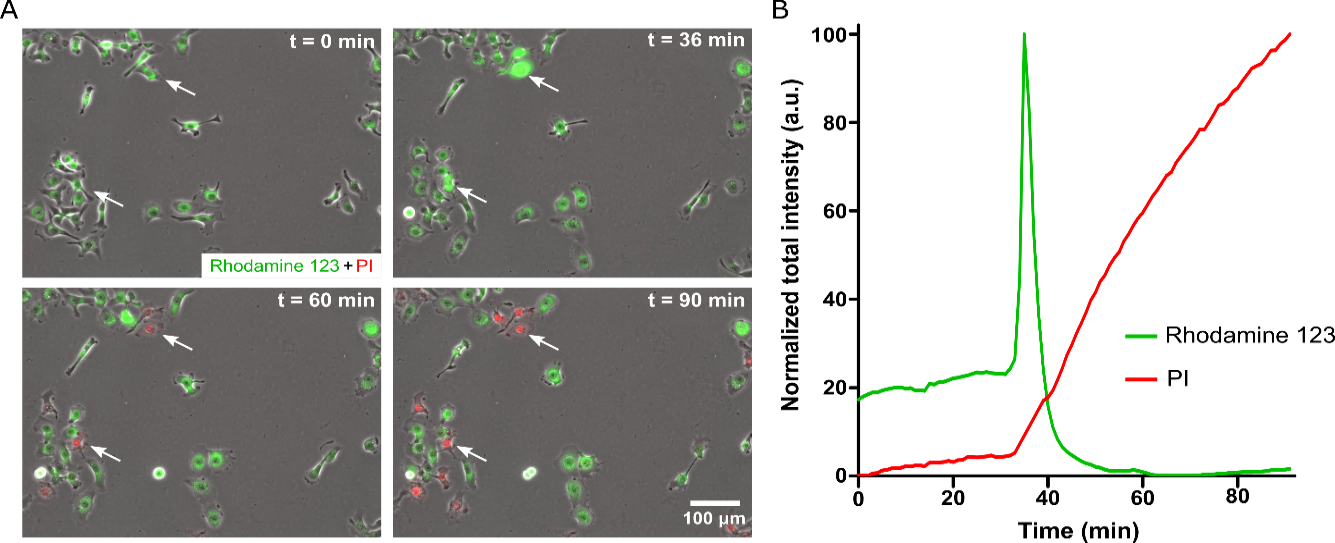
A variable amount of delay after PA exposure (<32 µM) suggests regulated cell death. Mitochondrial injury is central to regulated cell death. The existence of significant differences in nuclear shrinkage between PA-induced cell death and Triton X-induced cell death supports the observation that PA interacts with the cell membrane to induce cell death signaling, as opposed to simple mechanical disruption of the cell membrane. Given the known involvement of mitochondria in cell survival, maintenance, and regulated cell death, the examination of the effect of PA on mitochondria is critical. Visualization of mitochondria with Rhodamine 123, which binds to intact mitochondrial membrane with a highly negative potential (-180 mV), would enhance the examination process. Then the Rhodamine-123 dye would concentrate at the mitochondrial membrane and cause quenching, making the fluorescence intensity to be relatively low. When a mitochondrial injury occurs, and the membrane depolarizes, the dye would be released into the cytoplasm, where self-quenching events are less prevalent, and the fluorescence intensity increases. The treatment of Rhodamine 123 labeled cells with 30 uM PA would cause transient spikes in Rhodamine 123 fluorescence intensity followed by a complete loss of fluorescent signal (Figure 3A-B). The observation of media contained PI in these experiments would show a spike in Rhodamine 123 followed by PI uptake, which indicates the loss of membrane integrity and cell death. These results demonstrate that mitochondrial injury precedes the observed cell death and suggest the involvement of a signaling mechanism that includes mitochondrial injury.
Calcium Signaling
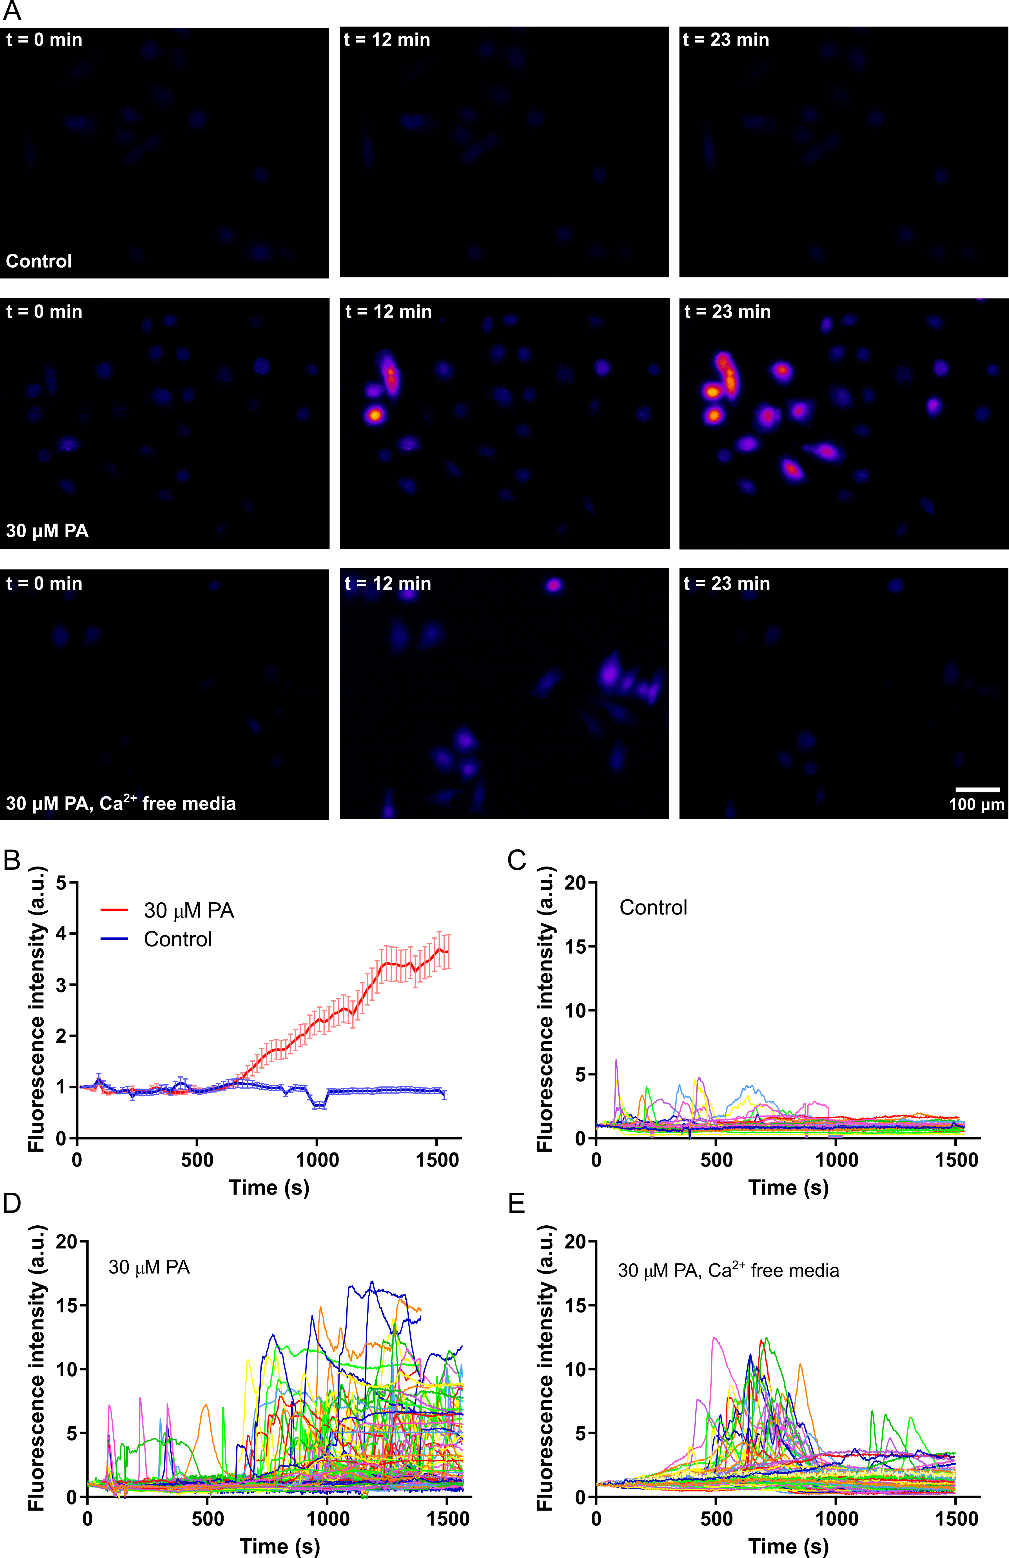
Given the results showing mitochondrial injury in response to PA, the study would further examine the mechanism. Mitochondrial injury is central to a large number of regulated cell death mechanisms, including apoptosis and oncosis. Cytoplasmic calcium is known to be vital to mitochondrial health, with elevated levels causing mitochondrial injury. The mitochondrial membrane contains calcium ion channels, which balance ion exchange between the mitochondria and cytoplasm, and excessive calcium in the cytoplasm can disrupt this balance. Without a proper ion balance, the mitochondrial membrane could depolarize, which can result in cell death. To examine if PA treatment causes elevation of cytoplasmic calcium, the study would perform calcium imaging, labeling the cells with the calcium-sensitive fluorescent dye Fluo-4. The observation would show an increasing number of Fluo-4 positive cells over time the presence of 30 uM PA starting a few minutes after PA treatment (Figure 4A). A repetition of the same experiment in calcium-free media would depict an increase in Fluo-4 positive cells a few minutes after PA treatment, but the overall fluorescence signal could lower and also subside after a few more minutes (Figure 4A). In control without any PA, notable changes in Fluo-4 signal would not occur (Figure 4A). Quantification of the average Fluo-4 signal per cell in control and 30 uM PA samples (in media with calcium) would reveal that Fluo-4 signal increases over time in the sample with PA while the signal remains around baseline in control with no PA (Figure 4B).
To elucidate the mechanism of increase in the calcium profile of the cells, a graph of the Fluo-4 signal for multiple single cells in all three samples would be plotted (Figure 4C). The study expects, in control with on PA, elevated calcium would be transient and return to baseline levels after some period of time (Figure 4C). However, in the presence of PA, there would be more cells showing calcium spikes, as well as more cells that show persistently elevated calcium levels that do not return to baseline (Figure 4D). The use of calcium-free media reduces the number of cells that show calcium spikes and prevents persistently elevated calcium levels (Figure 4E). Increased calcium response to PA, even in the absence of calcium in the cell media, would indicate that PA-induced calcium elevation is at least partially due to the release of calcium from intracellular stores, such as the endoplasmic reticulum. However, the release of intracellular calcium could cause the opening of plasma membrane calcium channels, leading to the influx of calcium from the extracellular environment.
The Fluo-4 experiments suggest the involvement of calcium signaling in PA-induced cell death. Therefore, it would determine if chelating intracellular calcium could rescue cell survival. The cells would be incubated with 1 uM and 10 uM BAPTA-AM, a calcium ion chelator, prior to treatment with 30 uM PA (Figure 5) and monitored the cell viability over time. Results would show that BAPTA-AM could partially rescue cells from PA-induced cell death (Figure 5). This finding would further confirm the involvement of calcium signaling in the PA-induced cell death mechanism. Thus, the study would hypothesize that the interaction between PA and the cell membrane causes the release of calcium from intracellular stores, possibly through activation of phospholipase C signaling. In a similar manner to which the PA can increase BMP-2-mediated ALP signaling [ref.], the PA could increase phospholipase C signaling by altering the lipid raft stability. However, the PA concentration would require to upregulate phospholipase C signaling may be higher than what is essential to enhance ALP signaling.
Conclusions
This study would focus on the examination of the downstream events after a cationic, weakly cohesive supramolecular PA assembly interacts with the cell membrane of CXT2 cells. It would show that this interaction initiates a signaling sequence that induces an increase in cytoplasmic calcium concentration, leading to mitochondrial injury and ultimate cell death. This signaling-mediated cell death would present a different cytotoxic mechanism to the traditional understanding of anti-cancer and anti-microbial peptides and peptide assemblies, which exert cytotoxic effects through direct physical disruption of the cell membrane. The supramolecular features of PA assemblies could enable this unique cytotoxic mechanism and provide opportunities for targeted cytotoxicity through the incorporation of cell-specific epitopes. These conclusions show that supramolecular structures would allow design factors to tune cell-material interactions precisely.
In summary, the presence of PAs as soluble signaling molecules in media with cervical cancer cells, a series of signaling sequences are activated to could lead to cell death, nucleus shrinkage, increased intracellular calcium concentration, decreased mitochondrial membrane potential, and protein degradation. With all of these results, the study would develop a potential signaling pathway that may be occurring to ultimate cell death (Figure 7). In the future, we plan to investigate mechanisms or aspects present in surviving cells to determine why they survive when the majority of treated cells die. This plan would involve studies of CXT2 cell resistance to PAs, the timings for actin and tubulin fluorescence loss in relation to cell death, and the growth of cells on PA as a substrate rather than as soluble molecules.