Introduction
For data to be meaningful, it has to be arranged in what Levi and Rubin call “meaningful pattern[s]” (p.10). In this work tables and other statistical graphics are used to plan, collect and prepare data on the US smartphone market and the movie industry.
The US smartphone Market Statistics
The table below summarizes Arik Hesseldahl’s story appearing on Bloomberg about the eye-catching quick rise in Google’s Android market share in the US. It shows that RIM and Apple hold the largest market share and that all players apart from Google Inc. registered a reduction in sales.
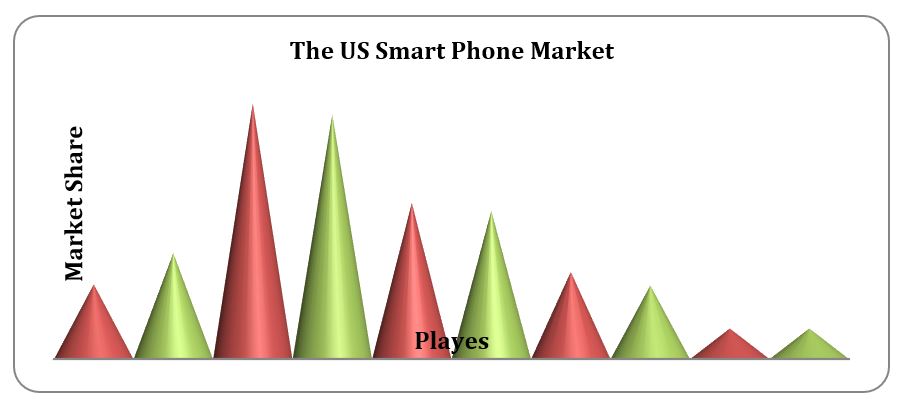
The conical histogram below gives a visual presentation of what happened.

The green corns representing activity during the second quarter show that Google gained sharply while the rest of the players experienced decline in market share. The fact that the other players experienced negative growth is a strong indicator that the market preference is quickly shifting from blackberry to androids.
Movie production statistics
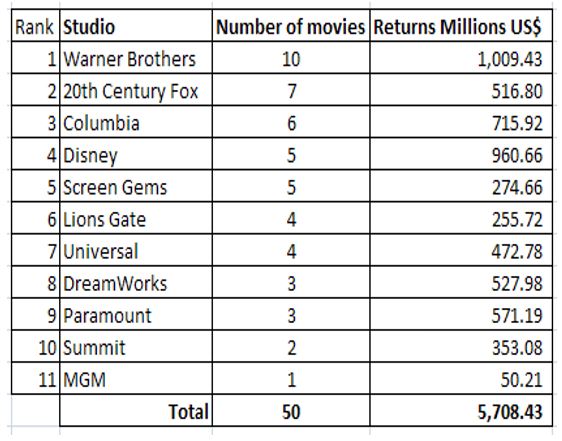
The frequency table below summarizes movie production studios whose movies hit the top 50 most watched movies. It ranks the movie makers according to how prolific they were in 2010. The data used in this table is collected from the “Yearly box office charts” in the article Lee’s Movie Info (leesmovieinfo.net).
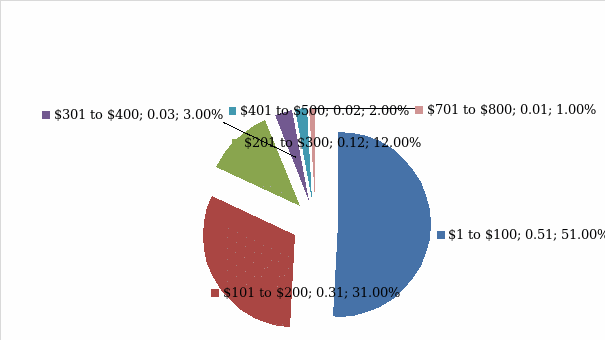
The pie chart below shows that 51% of the best 50 movies produced in 2009 and best 50 movies in 2010 are within the $1 to $100 million class.


Conclusion
There is a saying that ‘a picture speaks a thousand words.’ If research is done to collect meaningful data, statistical tables and graphics can be used to bring out information that is easy to understand.
References
Hesseldahl, A. (2010). Google Android’s U.S. Market Share Jumps as RIM Falls, ComScore Data Shows: Bloomberg. Web.
Levin, Richard I. & Rubin David S. (1991) Statistics for Management. Englewood Cliffs, N.J., Prentice Hall.
Yearly box office charts. (2010) Lee’s Movie Info. Web.