Introduction
Most investors sell stock when they feel that holding the stock would lead to a loss. However, buying stocks that drop in value is inherent to the nature of investing (Hafer & Hein, 2015). The objective, therefore, is not to avoid losses but to minimize losses. Realizing a capital loss before it gets out of hand distinguishes successful investors from the rest (Reschreiter, 2014). Many investors are particularly skeptical about their investments, especially following the loss of a significant investment. LVMH Vuitton SA (LVMH) deals in luxury goods. The company operates through five main segments. The five include fashion and leather, watches and jewelry, wines and spirits, perfumes and cosmetics, and selective retailing (Cavender & Kincade, 2014). In this paper, the author will analyze the stock of LVMH Company to come up with a two-year recommendation for a client.
Comparison of LVMH’s Main Ratios
Financial ratios form a basis for comparison between figures found in financial statements (Reschreiter, 2014). It is of great importance to compare the ratios of a firm over the past years to assess its growth.
Table 1. LVMH’s ratios. Source: (Cavender & Kincade, 2014)
Price-earnings ratio, P/E, indicates the dollar amount an investor needs to invest in a company in order to receive a dollar of the company’s earnings (Zhang, 2015). LVMH P/E has risen for the past three years (Cavender & Kincade, 2014). However, a significant drop was seen in 2014 at 11.73. The low P/E indicated that the company was undervalued during the financial year (Cavender & Kincade, 2014). However, the company’s P/E rose up again in 2015, indicating that investors could expect higher earnings value in the feature. Though P/B ratios do not directly provide information on the ability of the firm to generate profits or cash for shareholders it is important to note that LVMH price-to-book ratio has remained almost constant over the past three years. During these years, LVMH Moet Hennessy Louis’s highest return on equity was 23.22 with a low of 13.39 in 2013 (Cavender & Kincade, 2014).
Comparison with Competitor Firms
LVMH falls under the luxurious goods industry market. Over recent years it has risen to the top and has often being used as a benchmark for other players in the industry. However, the company still faces stiff competition from other brands. Its main competitors are Christian Dior, Burberry, ralph Lauren, and Michael Kors. In this section, the author compares the main ratios of the competitors to get a better understanding of the company’s position in the market (see Table 3).
Table3. P/E Ratio Comparison Table
Qualitative Analysis
Definition of Participants in the Sector
The luxury goods market has seen significant growth in the past three years. It is mainly due to the arising of new high-net-worth investors and customers (Zhang, 2015). Able customers seek luxurious goods in order to stand out in the first growing and changing fashion world. As such, luxury goods industries specifically target a class of young wealthy and affluent customers who are extremely brand-conscious. The United States luxury goods industry has a total of 5.2 million employees (Zhang, 2015). The employees in this sector consist of highly specialized and skilled employees well experienced with interacting with high-profile customers and goods. Growth in the personal luxury goods market which involves jewelers, watches and leather goods slowed to 1.3% from 3% in 2014. The section of the industry alone is valued at $253 billion (Zhang, 2015).
Supply and Demand
Supply and demand of luxurious goods is always in complete contradiction of the law of supply and demand (Hafer & Scott, 2015). Demand is proportional to the price asked for the commodities. In most cases, demand rises with price increases. The high prices make the goods more desirable as symbols of the buyer’s high social status hence a decrease in the price of commodities would lead to a decrease in demand (Hafer & Hein, 2015).
Problems Specific to the Sector
The rise of the internet has posed a series of unique challenges for luxury brands. Luxury goods are best valued and appreciated by customers when seen in person in stores. Display of the items as images in the internet has failed to produce the same luxurious appeal felt by customers when viewing the goods in person (Cavender & Kincade, 2014). Furthermore, customers are not able to tell real from counterfeit over the internet.
Labor
Most workers in the industry are highly skilled and trained. This is mainly because handling and creation of luxurious goods require extreme craftsmanship and discipline (Cavender & Kincade, 2014). Cheap labor is not applicable in this sector.
Quantitative Analysis of the Sector
Table 2. Ratios for Luxury Goods. Source: Zhang (2015)
As is evident above, P/E ratios are still lower than historical average at 15.6. As such, it potentially sets the stage for further growth opportunities in the industry. ROE ratio has constantly risen over the past years. The largest jump was seen in 2015 where the ratio lost from 18.6% in 2014 to 27.7%. It exceeded even the pre-crisis levels as a consequence of a large increase in financial leverage (Zhang, 2015).

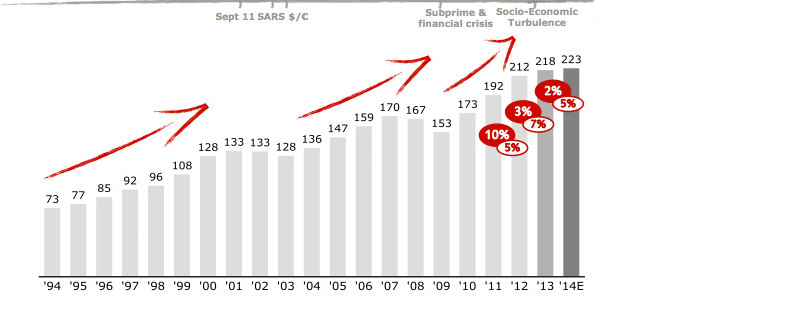
From the above chart, it is also clear that the industry has seen a constant growth over the past 20 years. It is crucial to note that even during periods of economic meltdowns, luxury goods were not critically affected as is in the case of other commodities (Zhang & Kim, 2013).
Global Economy
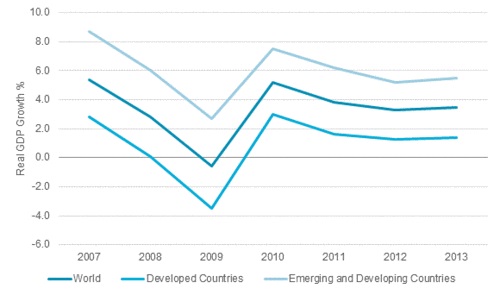
Global economic growth is central to economic development (Fasenfest, 2015). When national income grows, real people benefit. According to the IMF, the total value of goods and services manufactured in 2014 amounted for approximately 77.3 trillion US dollars (Fasenfest, 2015). USA ranked first among the states with the highest gross domestic product with 18 trillion US dollars followed China (Fasenfest, 2015). In the year 2015, there was a significant global economic growth. It was especially higher in developing countries than in industrialized nations. In total global economic growth amounted to 3.43% an increase from 3.31% (Mosca & Re, 2014). The global economy is set to grow at a constant rate owing to the stability of the major trading currencies and improved job markets (William, 2010). The falling of oil prices will also allow for a faster growth (see Table 3).

The information and technology sector of the global economy is posed to see the greatest spikes in income especially in the developing nations. According to IBISWorld, industry revenue in the sector has grown at an average annual rate of 23% over the last 3 years (Manfredi & Luciano, 2014).
Economic Cycle
Economic cycles are phases of economic growth and decline (Manfredi & Luciano, 2014). They include four major stages, contraction stage, trough, expansion, and peak (Manfredi & Luciano, 2014). Currently, the United States economy is at the end of the expansion stage. As such, many investors buy to book profits on recovery of the economy.
Growth Rate and Projections
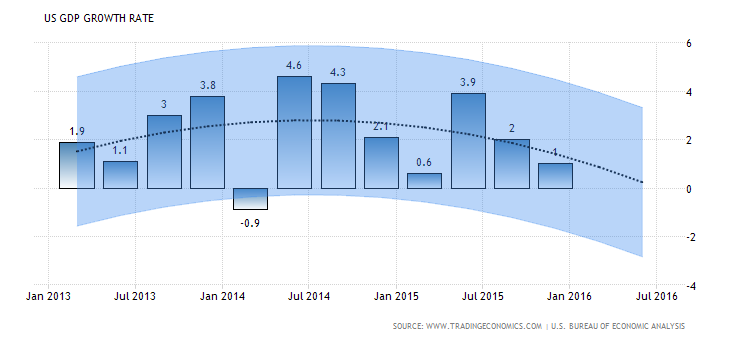
GDP growth rate is expected to be at 1.50% by the end of the quarter year of 2016 (Fasenfest, 2015). Looking forward, according to econometric models, the GDP growth rate is expected to trend at around 2.00 percent in 2020. It is mainly as a result of the improved job market and the falling of oil prices.

Conclusion
The global economy is set to see a constant growth for the next four years. From the analysis, I advise that the client does not sell his current holdings of stock at the LVMH Company. It is mainly because though the company has enormous competition, it has still managed to maintain its position as the go-to brand for luxurious goods commodities. Additionally, the client’s stocks are good growth potential in the long run. However as seen above, the technological sector is set to experience more growth in the coming years, hence the client would be better secure in this sector than in the luxurious goods industry.
References
Cavender, R., & Kincade, D. (2014). Leveraging designer creativity for impact in luxury brand management: An in-depth case study of designers in the Louis Vuitton Moet Hennessy (LVMH) brand portfolio. Global Fashion Brands: Style, Luxury & History, 1(1), 199-214.
Fasenfest, D. (2015) Global economy, global dialog. Critical Sociology, 40(2), 171-172.
Hafer, R., & Hein, S. (2015).The stock market. Westport, Conn.: Greenwood Press.
Manfredi, P., & Luciano, F. (2014). Cycles in dynamic economic modeling. Economic Modeling, 21(3), 573-594.
Mosca, F., & Re, P. (2014). International development strategies of luxury-goods players in China. Chinese Business Review, 13(6), 367-381.
Reschreiter, A. (2014). Extreme equity valuation ratios and stock market investments. Applied Financial Economics, 19(6), 433-438.
William, H. (2010). Financial statement analysis and the prediction of financial distress. Hanover: Now Publishers.
Zhang, B., & Kim, J. (2013). Luxury fashion consumption in China: Factors affecting attitude and purchase intent. Journal of Retailing and Consumer Services, 20(2013), 68-79.
Zhang, Z. (2015). Financial ratios and stock returns on luxury goods market. International Journal of Financial Research, 6(3), 23-45.