Saudi Arabian Amiantit Co.
Ticker: 2160 Recommendation: Sell.
Price: SR 16.96 Price Target: SR 10.91.
Highlights
- Amiantit’s financial performance is becoming less effective. Analysts expect that the firm will sustain the improvement it showed in 2013. They expect net income to decrease from SR 113 million to SR104 million in 2014, before increasing to SR 128 million in 2015.
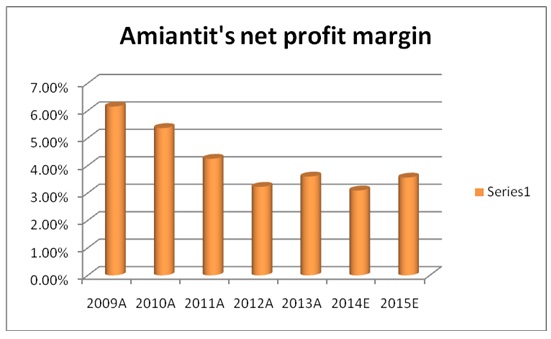
- The firm’s net profit margin declined, resulting from higher financial charges, higher cost of sales, and declining revenues.
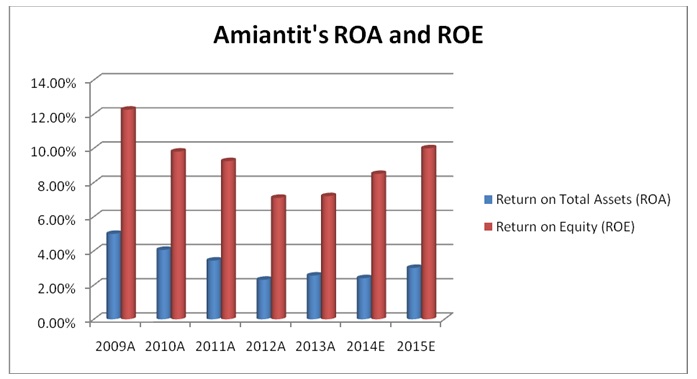
- Amiantit’s ROA and ROE also followed the same trend as that of profitability, declining in three consecutive years.
- The current ratio still shows the ability to meet short-term debt obligations. Its cash flow adequacy has decreased. Its debt is becoming larger compared with equity, which is declining. The risk to shareholders has increased.
- The valuation analysis leads to a target price of SR 10.91, which shows that the stock is overvalued. I recommend that the stock should be sold because its cash flow is inadequate to meet investors’ expectations. Its improvement in 2013 was not backed by effectiveness in generating revenues, but by increased efficiency. Efficiency is internal, which makes it easier to control. Effectiveness in generating revenues depends on external factors, which creates uncertainty about the firm’s future streams of income.
- The main risks include reliance on government projects, and stock market risk. There is a need for highly efficient systems because of low-profit margins, and high material costs.
Business Description
Amiantit Company is a Saudi Arabian joint-stock corporation that supplies a variety of pipes, and water supply management services. It supports global infrastructure in areas such as civil engineering, industrial development, and agriculture among others (Amiantit Co., 2014). The company was established in June 1968 in Saudi Arabia. It was listed on the Tadawul in November 1996 as a joint-stock corporation with 115.5 million shares issued at SR 10 (Mubasher, 2014).
The Amiantit Group consists of about 54 subsidiaries that operate in 70 countries worldwide (Amiantit Co., 2014). The company had 3,410 employees at the end of 2010 (GulfBase, 2014). There were 1,545 employees in Saudi Arabia, and 1,865 employees outside Saudi Arabia. The chairman is Prince Ahmed bin Khaled Al-Saud, and the manager is Dr. Sulaiman Abdulaziz Al-Tuwaijri (GulfBase, 2014).
The main strength of the company is its diversified product mix and its worldwide operations. Its worldwide operations may enable it to acquire the latest technology that may provide a competitive advantage.
The main weakness is that its financial performance declined between 2009 and 2012. It is only in 2013 that it showed improvement. Its operating cash flow ratio and cash flow adequacy declined between 2009 and 2012. Its cash conversion cycle increased, which might have caused the firm to use short-term debt for its operations, as can be seen in the analysis of financial statements (Amiantit Co., 2014). In 2013, the firm showed signs of recovery.
The Amiantit Group has 30 pipe system manufacturing facilities in 18 countries. It has 6 technology companies, 4 materials and supplies subsidiaries, and 8 supply and engineering companies (Amiantit Co., 2014).
The Group’s products include “Glass Reinforced Plastic (GRP) pipes, Glass Reinforced Epoxy (GRE) pipes, thermoplastic, concrete, polymer concrete, ductile iron, and water management services” (Amiantit Co., 2014, “Division”). The company mainly manufactures materials used in building and construction, which makes it reliant on the growth of the entire sector.
Industry Overview and Competitive Positioning
Amiantit is listed under the building and construction sector on the Tadawul stock market. The building and construction sector is mid-sized (Deloitte, 2013). There are entry restrictions for foreigners in the industry. Foreigners have to seek approval from Saudi Arabian General Investment Authority (SAGIA). They have to provide evidence that has worked in more than a single country and elaborate the benefits of their project to Saudi Arabian nationals, among other things (ACC, 2013). Strong emphasis is placed on environmental concerns.
The Saudi Arabian building and construction sector relies on contracts issued by the government. The Ninth Development Plan for the Kingdom of Saudi Arabia (KSA) provided positive prospects for major players in the industry. The government plan boosted the industry, which involved spending SR 1,444 billion (USD 385 billion) between 2010 and 2014 (Deloitte, 2013). UAE overtook KSA in the building and construction sector in 2012 with the value of contracts worth USD 16.2 billion. Saudi had USD 15.6 billion worth of contracts in the same year. Deloitte (2013) discusses that it was the first time since 2008 that the UAE had overtaken KSA in the value of contracts awarded in the region. Qatar had the third largest sector with USD 10.4 billion worth of contracts awarded in 2012 (Deloitte, 2013).
Saudi Arabia GDP is expected to have higher growth than in 2013 (Please see Appendix 1). The expected growth rate is 4.4% compared with 4.2% in 2014 (Al Rajhi Capital, 2014). There are better expectations because the government is expected to spend USD 228 billion in all sectors (Ali, 2013). Amiantit’s profitability is almost similar to other companies in the GCC. For example, Arabtec Holding (UAE) reported a net profit margin of 5.6% in 2010, and 5.2% in 2011 (Alpen Capital, 2012). Mushrif Trading & Contracting Co. had a net profit margin of 3.95% in 2013 (Reuters, 2014). The sector involves large contracts, which makes low-profit margins acceptable.
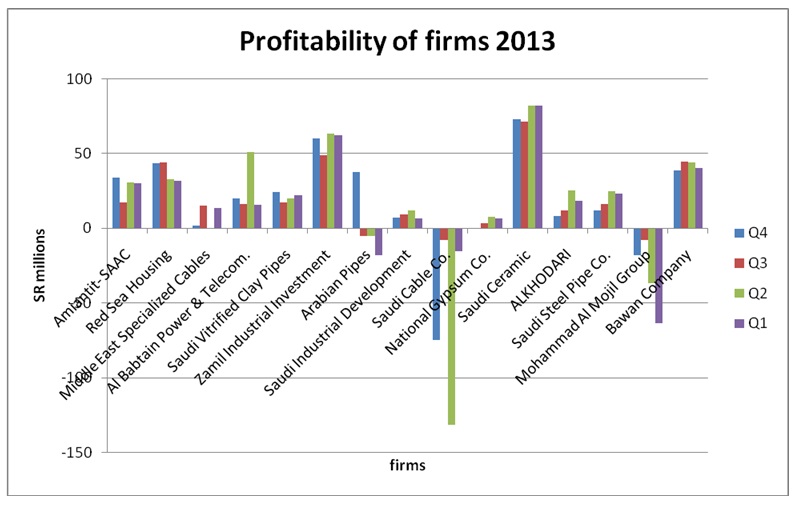
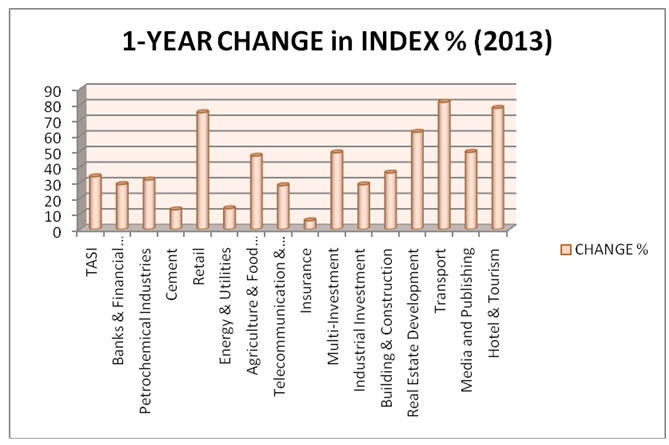
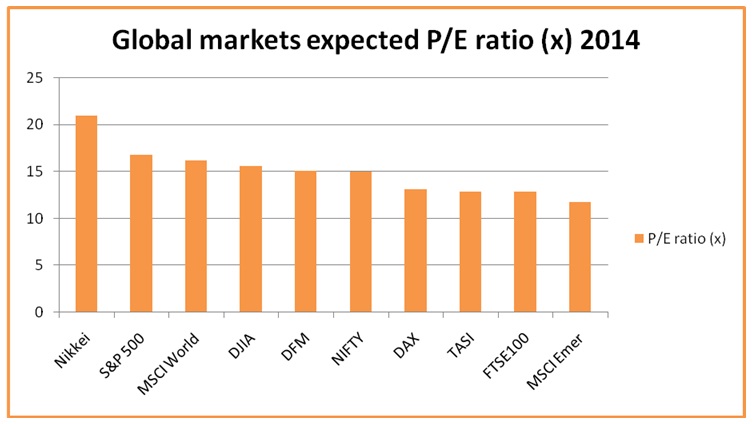
The Saudi building and construction sector is unstable with some of the firms reporting negative earnings in some quarters and positive in others within the same year (please see Appendix 2). There are several firms that are direct competitors and listed on Tadawul. There are about five firms listed on the Tadawul that directly deal in pipes. The restriction on foreign direct investment may reduce the intensity of rivalry (ACC, 2013). The restrictions ensure that only global players can enter the Saudi building and construction market. The building and construction underperform on the Tadawul, even though TASI has an average performance compared with other major global markets (Please see Appendices 3 &4).
Investment Summary
- The market price is SR 16.96, and the target price is SR10.91. The DDM and the DCF model show that the firm’s stock is overvalued by investors.
- The firm’s strategy is to release some of its assets to improve the firm’s liquidity.
- Analysts expect the firm’s net income to decline by 7.9% in 2014, and increase by 23.07% in 2015. ROA is expected to decline to 2.40% in 2014, and increase to 3.00% in 2015. ROE is expected to increase to 8.51% in 2014, and 10.0% in 2015.
- Amiantit is considered mid-sized based on the size of its capital. Its dividend and earning per share are among the highest in the industry. It has a wide product mix, which indicates that its income stream may be stable in the long run.
- The risk involved with investing in Amiantit’s stock includes the uncertainty in the building and construction sector, as indicated before, some firms have unexpected negative earnings. There is reliance on government contracts, which is associated with delays in payments, and cash flow adequacy problems. TASI performance is average compared with other major markets.
Valuation
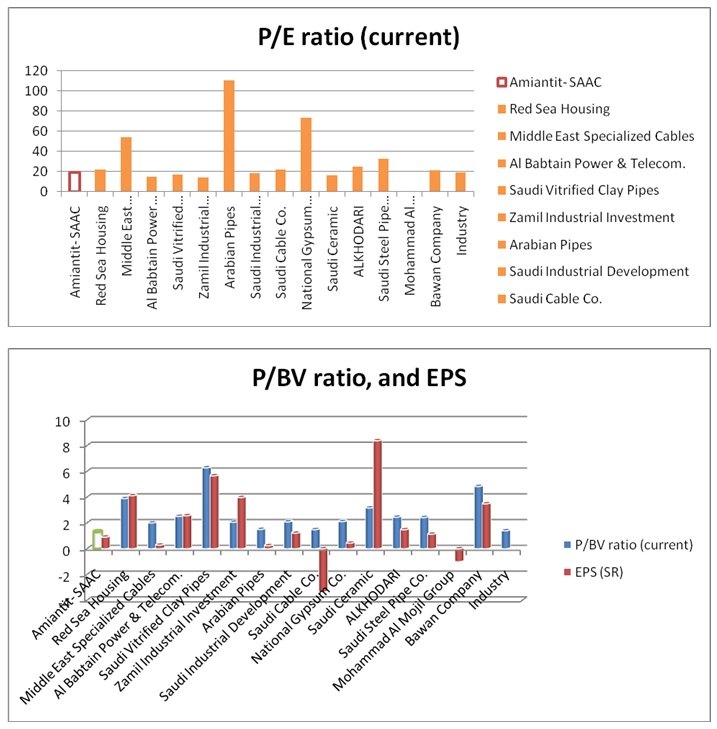
The two valuation techniques applied in the analysis of Amiantit Group are the Price/ Earnings ratio, and the Price/ Book Value. The Price/ Earnings ratio is compared in relation to the price of its peers because a higher stock price is likely to have a higher P/E ratio for similar earnings per share.
The Price/ Earnings ratio is used to indicate the expectations that investors have placed on the stock compared with its peers. Amiantit P/ E ratio is lower than all of its peers in the building and construction industry (Please see Appendix 4). It is also lower than the industry’s average. Compared with the prices of companies that are closer to SR 16.96, it can be seen that Amiantit’s performance is better than Middle East Specialized Cables, Saudi Cables, and others. On the other hand, it can be seen that Saudi Arabian Industrial development had a better performance than Amiantit. The P/E ratio also shows that Amiantit is likely to meet the investor’s expectations in generating earnings that most of its peers, except for Saudi Ceramic, Al Babtain, and Saudi Vitrified. Amiantit’s P/E ratio declined in 2011 despite having a higher EPS than in 2010. The P/E ratio increased in 2013, which indicates higher investor expectations than in the previous years. The low investor confidence in Amiantit’s stock is supported by the financial analysis, which will show that the firm’s future income streams are uncertain.
The P/ BV ratio indicates whether a stock is overvalued by investors. Amiantit’s stock market price is very close to its book value. Its P/ BV ratio is 1.2889, which is lower than the industry’s average of 1.4 (Bloomberg, 2014). It is also the lowest in the sector, among listed companies. It may indicate that Amiantit’s stock is undervalued because the market is expected to be much higher than the book value. The low P/ BV ratio shows that investors have lost confidence in Amiantit’s stock compared with its peers.
The DDM gives an estimated value of SR 10.13, and the DCF model gives a value of SR17.88. The expected value of the stock is SR 10.91 when the DDM is given a 90% weight, and the DCF model is given a 10% weight (Please see Appendix 5). The target price is 55.5% lower than the market price. The target price indicates that the stock is overvalued considering its future dividends. However, considering the DCF model, the investors have given a market price that is nearly accurate.
Financial Analysis
The financial analysis considers the net income, net profit margin, EPS, ROA, and ROE when evaluating the financial position of Amiantit Group for the last five years. The analysis also considers the profitability of the firm compared with its peers in the first quarter of 2014, and the expected performance for the next two years. Net profit margin is more important than net income because it shows the efficiency of the firm in generating earnings from revenues. ROA shows efficiency in utilizing assets to generate earnings. ROE shows efficiency in utilizing equity. EPS shows the additional value created for shareholders.
2010 The net income declined by 18.46% from the previous year. It declined from SR 202.475 million to SR 165.102 million. EPS decreased from SR 1.753 to SR 1.429, representing a decline of 18.5%. ROA declined from 4.99% to 4.06% and ROE from 12.26% to 9.81%. ROA and ROE show that there is a decline in the firm’s efficiency in utilizing assets and equity. Revenues declined in 2010, as presented in the financial statements, by 6.5%. The EBIT in 2010 (SR 304.725 million) is higher than the one in 2009 (SR 299.650 million), which indicates that the main cause of the reduction in net income is likely to be accrued taxes. Taxes (zakat) increased from SR 31.305 million to SR 83.75 million. It is the main cause for the reduced profitability.
2011 Amiantit’s net income declined even further, from SR 165.102 million to SR 151.248 million, representing an 8.4% decline from 2010. EPS declined for the second consecutive year, from SR1.429 to SR 1.310, an 8.4% decline from 2010. ROA declined from 4.06% to 3.43% and ROE from 9.81% to 9.25%. They indicate that the firm became less efficient and less effective in utilizing assets to generate income. The value created for the owners of the firm declined compared with the two previous years. In 2011, revenue increased by 15.76% compared with 2010. Net profit margin declined from 5.36% to 4.25%. The decline in profitability can be attributed to the increased cost of sales, which results in lower gross profit despite increased revenues. Increased interest expense (finance charges) is another cause, which is higher in 2010 than in 2011.
2012 Amiantit’s net income declined by a large margin, from SR151.248 million to SR 111.338 million, representing a 35.85% decline. Net profit margin also declined for the third consecutive year. EPS declined by 26.4% from the value generated in 2011. ROA and ROE also declined for the third consecutive year. The three consecutive years of declining financial performance may explain the low investor expectations portrayed by the low P/E ratio and P/ BV ratio.
2013 The decline in revenues is overshadowed by the increased profitability. Amiantit’s net profit margin increased from 3.22% in 2012 to 3.60% in 2013. The net income increased from SR 111.338 million in 2012 to SR 112.614 million in 2013, representing a 1.15% increase. There was a slight increase in EPS, from SR 0.964 to SR 0.975. ROA and ROE also increased, each with a small positive change. In 2013, Amiantit indicates that it is ready to change the four-year trend, which has involved a continuous decline in profitability, and efficiency.
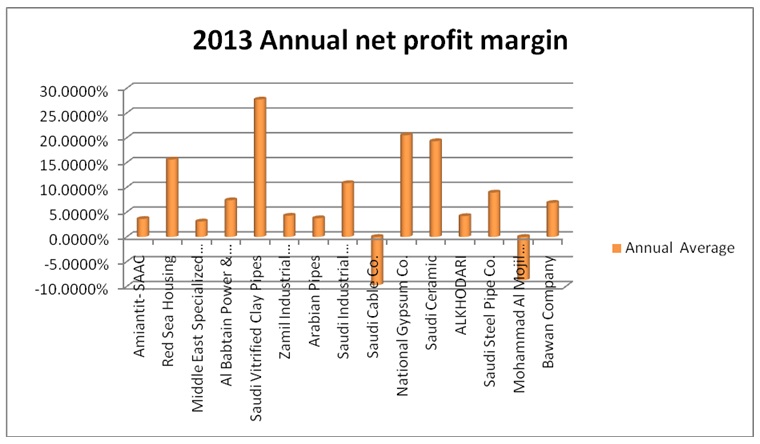
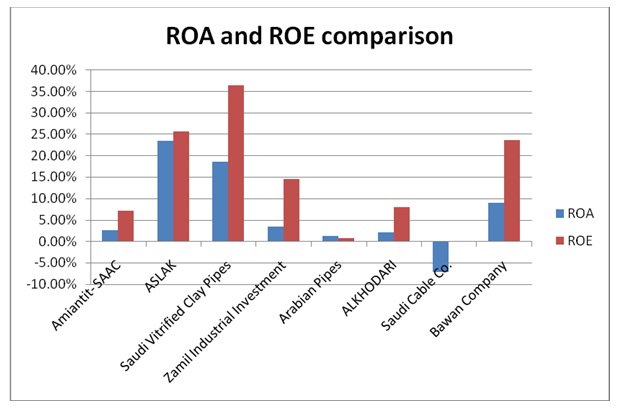
Overall Amiantit’s financial performance declined in three consecutive years. The improvement in 2013 is not supported by an increase in revenues, but an increase inefficiency. Sustainable improvement in financial performance requires the firm to increase its revenue, and improve its efficiency. Efficiency by itself may not take the firm to higher profitability as it had in 2009. When compared to its peers, Amiantit’s profitability is among the lowest (Please see Appendix 6 -11). The firm sold its ownership in Jos Hansen & Soehne Gmbtt (Germany) for SR 19.8 million in 2013 and intended to sell its stake in Chongqing PolyComp (India) (Amiantit Co., 2014). The firm targets to increase its liquidity.
Other major indicators
Other major indicators used to analyze Amiantit’s financial performance include current ratio, cash flow adequacy, long-term debt to total capitalization, and debt to equity ratio.
The current ratio has declined in the five-year period, but it still remains within the required levels. The building and construction industry may require higher current ratios because of delays in payment that may be experienced, especially in an industry that relies on government contracts. The current ratio shows declining liquidity.
Cash flow adequacy ratio has declined in the three middle years before regaining in 2013. The firm did not have adequate cash in 2011 and 2012, which may be a major concern for its increased interest expense during the period.
Long-term debt to total capitalization increased in 2012, and has not returned to the same level it was in 2009. The level of debt has become larger, which portrays that the firm financial charges are likely to increase.
Debt to equity ratio indicates that the debt exceeds the equity in proportion, which indicates that bankruptcy may be possible if the firm generates losses repeatedly.
Investment Risks
The industry has a number of risks derived from the uncertainty that surrounds the external business environment. The following are some of the risks.
- Stock market risk: Tadawul is considered to be more sensitive to changes in market expectations because individuals, rather than corporations, are the major shareholders (Shuaa Capital, 2009).
- Uncertainty in the building and construction sector: The building and construction industry does not have a stable growth rate (Bank Audi, 2013). Firms can report profit and losses within the same year. In 2012, UAE was the largest contractor, and in 2013, Saudi Arabia regained its position as the largest.
- High cost, high rivalry, and low profit margins: The cost of materials and intensity of rivalry is high, which results in low profit margins. Net losses are difficult to avoid (Alpen Capital, 2012).
- Reliant on government contracts: Reliant on government contracts may result in delays in payment, which may cause cash flow inadequacy (Deloitte, 2013).
Appendices
Appendix 1
Appendix 2
Appendix 3
Appendix 4
Appendix 5
Dividend discount model (DDM)
Pcs = D1/ (1 + Kcs) + D2/ (1 + Kcs)2 + D3/ (1 + Kcs)3+ …..+Dt/ (1 + Kcs)t
According to Kettell (2002), Pcs is the intrinsic value of stock, and D is the expected dividend in the future.
Pcs = the sum of discounted dividends in period t
The calculation considers that the firm may operate for 40 years, and the investor expects a return of 8%, considering the risk derived from the sector. The average dividend growth during the five years was 10%, but the firm is unlikely to sustain the growth rate, which makes a 5% growth rate to be used. Future annuity at 5% for 40 years is 120.7998, and the present value annuity factor for 8% in 40 years = 11.92461
Pcs = 1.00 *(120.7998)/ 11.92461 = SR 10.13 (90% weight)
Discounted Cash Flow model (DCF model)
DCF = Σ CFn/ (1 + i) + TV/ (1 + i)t
According to Larrabee & Voss (2013), CF is the expected cash flow in each period, i is the discount rate, n is the number of periods, TV is the terminal value. The terminal value is the value of equity, and its growth rate. The calculations consider 5 years of cash flows, and a growth rate of 1% for equity. Equity has a low growth rate because Amiantit’s equity has decreased in the five-year period, year after year. The average CF in the five-year period is SR -99,021. Using present value annuity for CF (8%), and present value factor for the terminal value, the DCF is calculated as shown below.
DCF = SR (-99,021*5)/ (3.99271) + (1,698,788,000 equity * 4.85343)/ (3.99271) = SR 2,064,876,622.10
Dividing by the number of shares (115,500,000)
DCF = SR 17.88 (10% weight)
10% DCF + 90% DDM = (0.1 * 17.88) + (0.9 * 10.13) = SR10.91
Appendix 6
Appendix 7
P/E ratio, P/BV ratio, and EPS compared with peers, Source: Bloomberg (2014).
Appendix 8
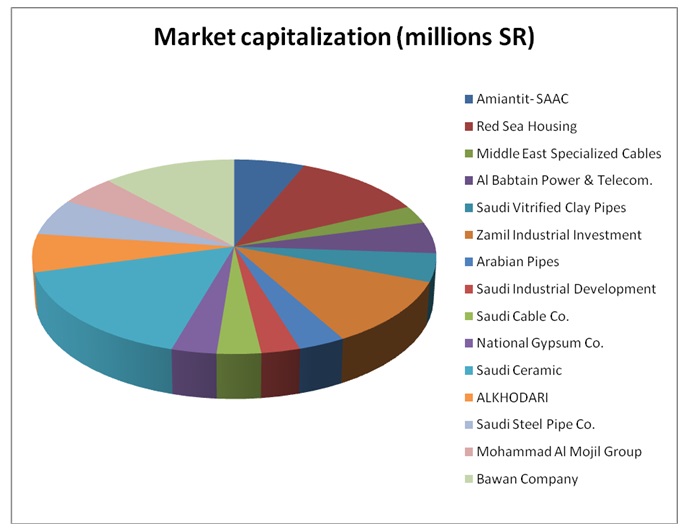
Appendix 9
Amiantit’s net profit margin trend, Source: 4-traders (2014).
Appendix 10
Appendix 11
References
ACC. (2013). Construction and project in Saudi Arabia: Overview. Web.
Ali, J. (2013). Saudi Arabia uses current budget surpluses for future. Web.
Alpen Capital. (2012). GCC construction industry: Residential and commercial building construction. Web.
Al Rajhi Capital. (2014). Saudi Arabia: Equity market outlook. Web.
Amiantit Co. (2014). Divisions. Web.
Bank Audi. (2013). Saudi Arabian economic report. Web.
Bloomberg. (2014). Abdullah A.M. Al-Khodari Sons Co. ALKHODAR: AB. Web.
Bloomberg. (2014). Al Babtain Power & Telecommunication Co ALBABTAI: AB. Web.
Bloomberg. (2014). Arabian Pipes Co APCO: AB. Web.
Bloomberg. (2014). Mohammad Al Mojil Group Co. MMG: AB. Web.
Bloomberg. (2014). Saudi Arabian Amiantit Co SAAC: AB. Web.
Bloomberg. (2014). Saudi Cable Co SCACO: AB. Web.
Bloomberg. (2014). Saudi Ceramic SCERCO: AB. Web.
Bloomberg. (2014). SIDC SIDC: AB. Web.
Bloomberg. (2014). Zamil Industrial Investment Co ZIIC: AB. Web.
Deloitte. (2013). GCC Powers of 2013: Construction section overview. Web.
GulfBase. (2014). Bawan Co. Web.
GulfBase. (2014). Building & Construction sector companies’ recent profit/ Loss announcement. Web.
Kettell, B. (2002). Valuation of internet and technology stocks: Implications for investment analysts. Oxford: Butterworth-Heinemann.
Larrabee, D., & Voss, J. (2013). Valuation techniques: Discounted cash flow, earning quality, measures of value added, and real options. Hoboken, NJ: John Wiley & Sons.
Mubasher (2014). Saudi Arabian Amiantit. Web.
Reuters. (2014). Mushrif Trading and Contracting Co KSCC (MTCC.KW). Web.
Shuaa Capital. (2009). 2009 vision. Web.
Tadawul. (2014). Market Indices: 1 Year. Web.
Tadawul. (2014). 2160 – Saudi Arabian Amiantit Co. Web.
4-traders. (2014). Saudi Arabian Amiantiti Co SJSC (2160). Web.