S — Strengths
Reynold Centers attracts new customers: In the past month and a half (08/01/21-09/13/23) over 10,311 new users visited the site, which is 94% of the total audience.
Reynold Centers is geographically popular: Both new and current customers are in differentregions: Illinois (~24%), California (~10%), New York (~8%), Virginia (~7%) and Texas (~6%), etc.
Multinational audience: Among new Reynold Center’s users, 78% spoke en-us, 8% en-gb, 2% ru-ru, and about 1.5% zn-ch.
W — Weaknesses
Low retention rate: The average pageview time was 33 seconds, with 90.16% of users leaving the site immediately after logging in.
Screen resolutions: Among new users, a high percentage of bounces is typical for guests with 1024×768 and 800×600 screen resolutions — probably the site is not displayed correctly.
Poor design: The high bounce rate (90.47%) with the lowest pageview time (only 31 seconds) is specific to the desktop version of the site, probably due to inappropriate design.
O — Opportunities
Focus on age: A total of 59% of both current and new customers are between the ages of 18 and 34, which means the multiplier should be placed on them.
Conversion by traffic: The highest conversion rate for organic traffic was for an adult audience (3.02), while conversion by email (4.17) was only for younger users. It is necessary to strengthen these areas by investing in targeting advertising.
YouTube CTR: For all videos on YouTube it was shown that the correlation coefficient between viewing time and CTR is negative (R=-.117). Therefore, it makes sense to shorten videos to increase CTR.
T — Threats
Addicted to Facebook: Among social referrals, 59% of users came from Facebook, which is known to often break down in the last month.
Decline in popularity: The number of Reynold Center views, regular or unique, has been dropping steadily since the beginning of the period: from 9,169 on August 1 to 4,594 on September 13.
Technical bugs: For Windows, which gives 59% contribution to page views, the average page load time dropped by 14% over the average, resulting in a higher bounce rate (91.65%).
Most Popular Content
- As before, the 09/01 to 10/13 interval is used for marketing analysis.
- The most popular page is “How to Ask for an Interview via Email: 5 Key Steps”(21.10% of total views, 21.44% of unique views and 158.80% of average site visit time).
- In contrast, in terms of the most time per page, “Proxy Guide: Resources” is the leader with 948.86% of the average time, but the rest of the site’s metrics (views and unique views) prove unsuitable.
Thus, the most effective content on Reynold Center is “How to Ask for an Interview via Email: 5 Key Steps” for the best compromise between retention time, views and unique views.
The Value of Referral Traffic
- Referral traffic comes to Reynold Center through 114 channels, and the contribution of this category to total traffic does not exceed 3.29% during the reporting period.
- Among the leaders (by number of users) of referral backlinks, apart from social networks, are Baidu, Cronkite, GIJN, Google News and Bing.
- Baidu brought 15.41% of users and 16.51% of unique users, but the bounce rate was 100%, which means it was not useful traffic.
- Then the most valuable backlink (other than social) was cronkite.asu.edu at 4.46% users, 3.74% new users and 44.44% bounce rate.
The ranking of the most valuable referral traffic is evaluated by user engagement, including new users, as well as through sessions and average page view time.
Key Audience Demographics
Demographic and social metrics were studied for the key audience. The following findings were found:
- Average age is 25-34 (31.07%).
- Majority are female (58.5%).
- A combined 9.54% are interested in Media & Entertainment/Movie Lovers, Shoppers/Value Shoppers, Beauty & Wellness/Frequently Visits Salons.
- Buyer Interest Segments: Employment (3.39%), Financial Services/Investment Services (3.13%), Education/Post-Secondary Education (3.13%).
- Most of the audience (78.07%) uses American English.
- The base of the audience is represented by the USA. — 56.11%.
Bounce Rate Date
A separate metric presenting potential for study is the bounce rate as a function of time. The data have been thoroughly examined and verified.
- The dynamics of the bounce rate over a month and a half were unstable.
- Most often, the bounce rate increased in the second half of the week, closer to the weekend.
- The highest bounce rates were on Saturday, August 7 (96.27%) and Saturday, August 21 (96.27%).
Dominant Social Media
In terms of user engagement, time and bounce rate, Facebook is the dominant social network for Reynold Center. Here is why:
- Facebook brought in 58.95% of total sessions.
- The number of new users is 62.79%.
- About 1 in 7 people out of 100 interact with the page: bounce rate of 92.86%.
- On average, users took 1.12 seconds per page.
- The average visit was 40 seconds.
- According to the flow, out of 58.95% of the sessions, not a single one led to a third interaction.
Three Facebook Posts with the Highest Reach
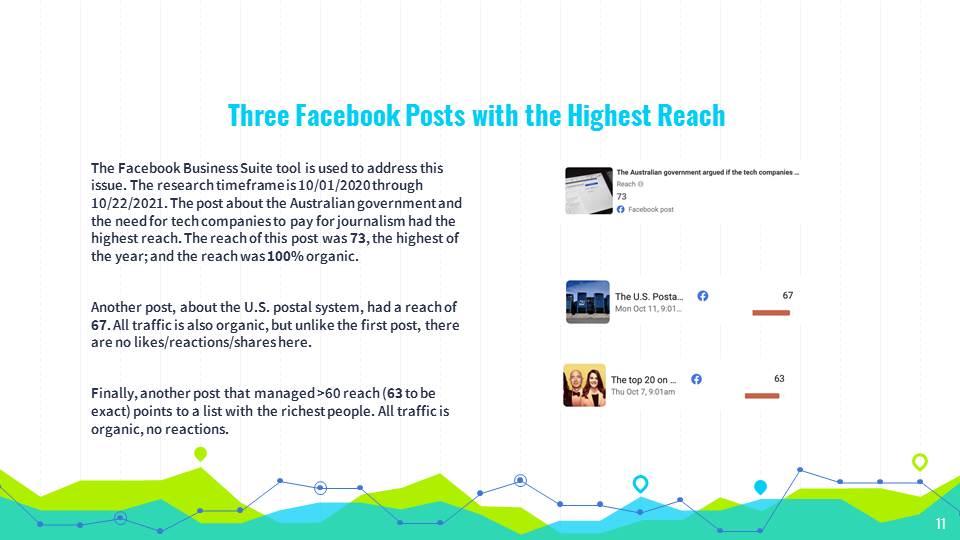
The Facebook Business Suite tool is used to address this issue. The research timeframe is 10/01/2020 through 10/22/2021. The post about the Australian government and the need for tech companies to pay for journalism had the highest reach. The reach of this post was 73, the highest of the year; and the reach was 100% organic.
Another post, about the U.S. postal system, had a reach of 67. All traffic is also organic, but unlike the first post, there are no likes/reactions/shares here.
Finally, another post that managed >60 reach (63 to be exact) points to a list with the richest people. All traffic is organic, no reactions.
Three Facebook Posts with the Highest Engagement
The Facebook Business Suite was also used to track engagement. The following engagement rating statistics are fair for Reynolds Center from October 1, 2020 to October 22, 2022, in descending order of that ratio:
- The Australian government (02/24/2021) — 7;
- Job openings jumped 749,000 (09/10/2021) — 6;
- The deadline has been extended! (08/04/2021) — 5;
- The Stakeholders of Daylight Saving Time (11/11/2020) — 5;
- How millions of small investors (01/29/2021) — 4.
Thus, 80% of the posts with maximum engagement are from 2021, with 60% of the posts with maximum engagement in late summer and fall, while the post with maximum engagement was published in late winter.
Preferred Content Type
First, it is worth emphasizing what is meant by resonating with the audience’s interests. The audience will only like, share, and respond to posts reflected in them and evoke thoughts, feelings and/or emotions. For this reason, an interaction rating that includes the metrics described above is a competent tool to use. It is suggested to use CrowdTangle, which allows for tracking these dynamics throughout the year. For example, link posts had the highest interaction rate (87% or 33/38). Video posts took only 13% (or 5/38), and the other types of content failed to engage the audience in any way. Links, hence, are the preferred content among Reynolds Center audiences.
Preferred Content Type at Reynolds Center Competitors
To track competitive preferred content, a manual search was conducted on Facebook competitors suggested by the platform itself. CrowdTangle provided the following data, for the three-month reporting period:
- Reynolds Center — links 88% (15/17);
- Ag Media Summit — photos 80% (24/30);
- SABEW — photos 93% (37/40);
- National Center on Disability and Journalism (NCDJ) — links 84% (82/98).
So it can be seen that both links and photos are the preferred content among Reynolds Center competitors.
Advertising Effectiveness
Facebook’s built-in functionality was used to track the effectiveness of ads over the past year. However, it is worth saying that only three ad campaigns were run in 2020, while there were none at all in 2021. The following ad metrics were found:
- Get more engagement (07/24/2020) – 124 reach, 67 engagements, 5 days, $0.15 CPE, F/M(%) = 33.1/66 9;
- Get more engagement (07/15/2020) – 6340 reaches, 275 engagements, 5 days, $0.73 CPE, F/M(%) = 51.3/48.7;
- Get more website visitors (07/07/2020) – 375 reaches, 12 engagements, 6 days, $4.17 CPE, F/M(%) = 57.3/42.7.
Thus, in terms of value for money, the July 15, 2020 ad campaign was the most effective and reached up to 6,340 users. More accurate data shows that the ad yielded 14 shares, 11 clicks on the link, and two post saves. 67% of users used the mobile app for this ad, and the majority (15.5%) were from California.
Facebook Presence
CrowdTangle allows comparing Reynold Center’s presence and competitors on Facebook. The reporting period from October 1, 2020, to October 22, 2021, is used:
- Interactions: 43% NCDJ, 41% Ag Media, 12% SABEW, 4% Reynold Center;
- Video views: 70% Ag Media, 30% Reynold Center;
- Post count: 56% Reynold Center, 17% SABEW, 15% NCDJ, 12% Ag Media;
- Followers: 40% NCDJ, 29% Ag Media, 18% Reynold Center, 13% SABEW;
- Followers growth: +9.64% SABEW, +8.73% Ag Media, +6.40% NCDJ, -0.91% Reynold Center.
Instagram Presence
CrowdTangle allows comparing Reynold Center’s presence and competitors on Instagram, too. The reporting period from October 1, 2019, to October 22, 2021, is used:
- Interactions: 100% NCDJ;
- Post count: 100% NCDJ;
- Total post count: 78% NCDJ, 21% SABEW, 1% Reynold Center;
- Total followers: 397 NCDJ, 52 SABEW, 14 Reynold Center;
- Total following: 521 NCDJ, 108 SABEW, 53 Reynold Center.
Note: Ag Media Summit is not on Instagram. In addition, the observation period was extended by one year because none of the accounts had actual posts from October 1, 2020.
Competitor Keywords
- For Reynolds Center, reynolds center (810), burt reynolds center fold (510), donald w. reynolds nation center for business journalism logo hi res (28), donald w. reynolds nation center for business journalism logo (28);
- For Ag Media Summit, Ag Media Summit (380), ag media summit 2019 (80), ag media summit 2018 (70), 2018 ag media summit awards (40);
- For SABEW, SABEW (730), sabew stylebook pdf (110), sabew awards (100), sabew in journalism (55);
- For NCDJ, the national center for disability journalism (ncdj) (12), disability language style guide, from the national center on disability and journalism (12), national center for disability journalism (12).
Related Issues (Top Google Ads Buy Recommendations)
- For Reynolds Center, people finder (142k), people search free (82.6k), virtual business phone service (2.1k), small office phone systems (1.2k);
- For Ag Media Summit, ag jeans sale mens (230), ag jeans on sale (190), conference event apps (180), how to get leads from social media (165), Media (Google Trends);
- For SABEW, [via Google Trends] Company, The Wall Street Journal, Award;
- For NCDJ, how to get disability (10.8k), how to sign up for disability (3.2k), how to apply for disability benefits (1.8k).
SoundCloud Social Media
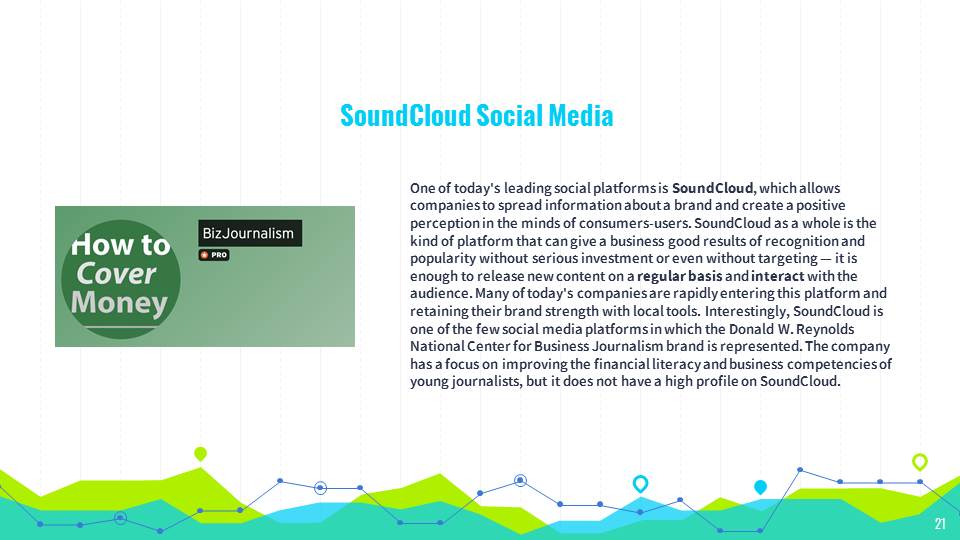
One of today’s leading social platforms is SoundCloud, which allows companies to spread information about a brand and create a positive perception in the minds of consumers-users. SoundCloud as a whole is the kind of platform that can give a business good results of recognition and popularity without serious investment or even without targeting — it is enough to release new content on a regular basis and interact with the audience. Many of today’s companies are rapidly entering this platform and retaining their brand strength with local tools. Interestingly, SoundCloud is one of the few social media platforms in which the Donald W. Reynolds National Center for Business Journalism brand is represented. The company has a focus on improving the financial literacy and business competencies of young journalists, but it does not have a high profile on SoundCloud.
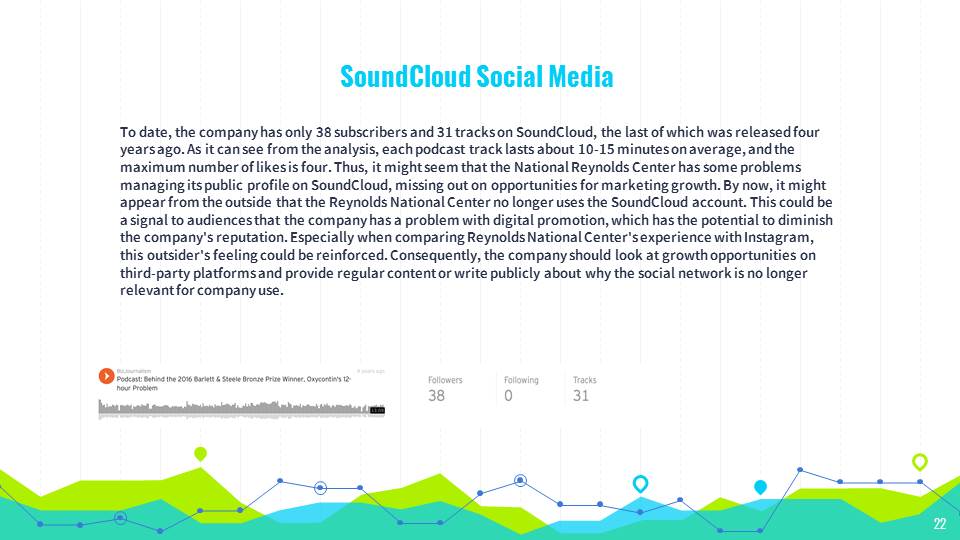
To date, the company has only 38 subscribers and 31 tracks on SoundCloud, the last of which was released four years ago. As it can see from the analysis, each podcast track lasts about 10-15 minutes on average, and the maximum number of likes is four. Thus, it might seem that the National Reynolds Center has some problems managing its public profile on SoundCloud, missing out on opportunities for marketing growth. By now, it might appear from the outside that the Reynolds National Center no longer uses the SoundCloud account. This could be a signal to audiences that the company has a problem with digital promotion, which has the potential to diminish the company’s reputation. Especially when comparing Reynolds National Center’s experience with Instagram, this outsider’s feeling could be reinforced. Consequently, the company should look at growth opportunities on third-party platforms and provide regular content or write publicly about why the social network is no longer relevant for company use.
Capstone — “Green Business Reporting”
Objective
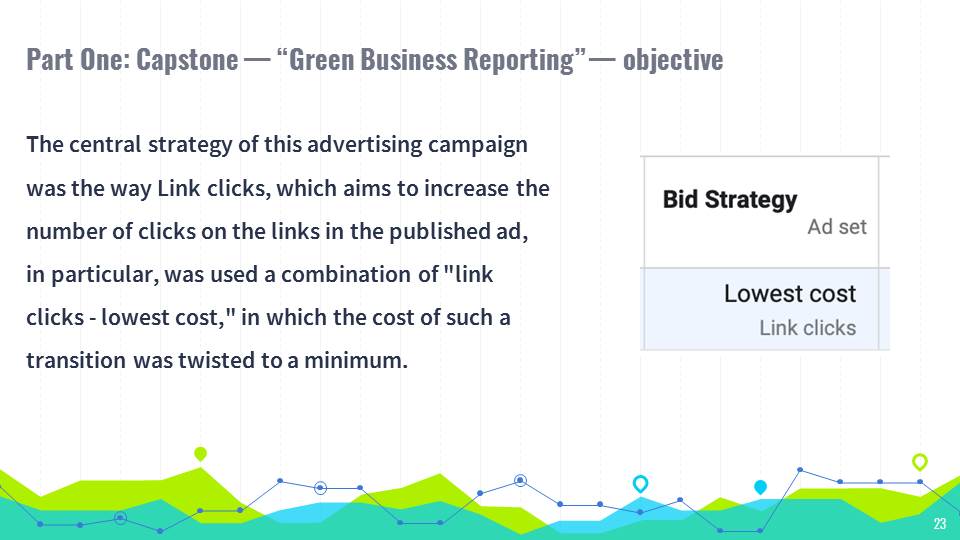
The central strategy of this advertising campaign was the way Link clicks, which aims to increase the number of clicks on the links in the published ad, in particular, was used a combination of “link clicks – lowest cost,” in which the cost of such a transition was twisted to a minimum.
Results
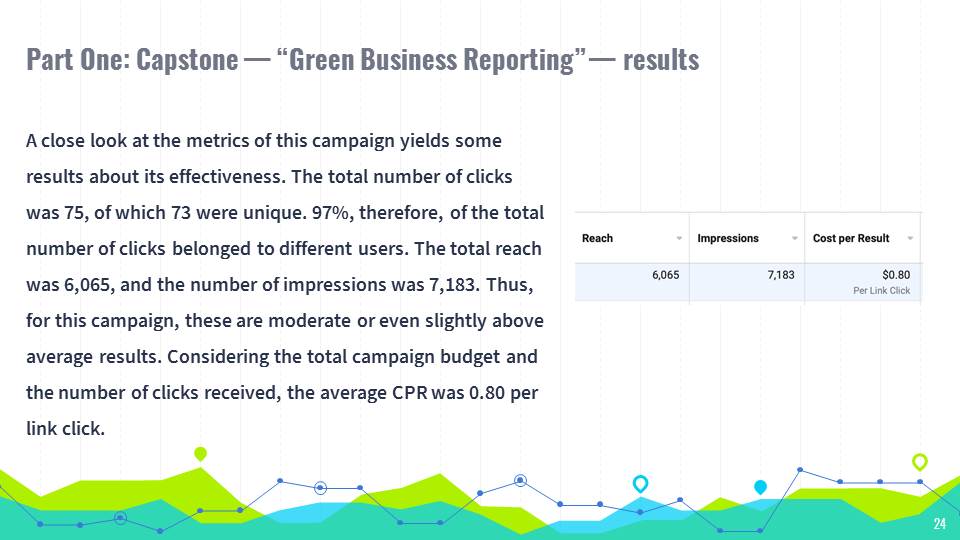
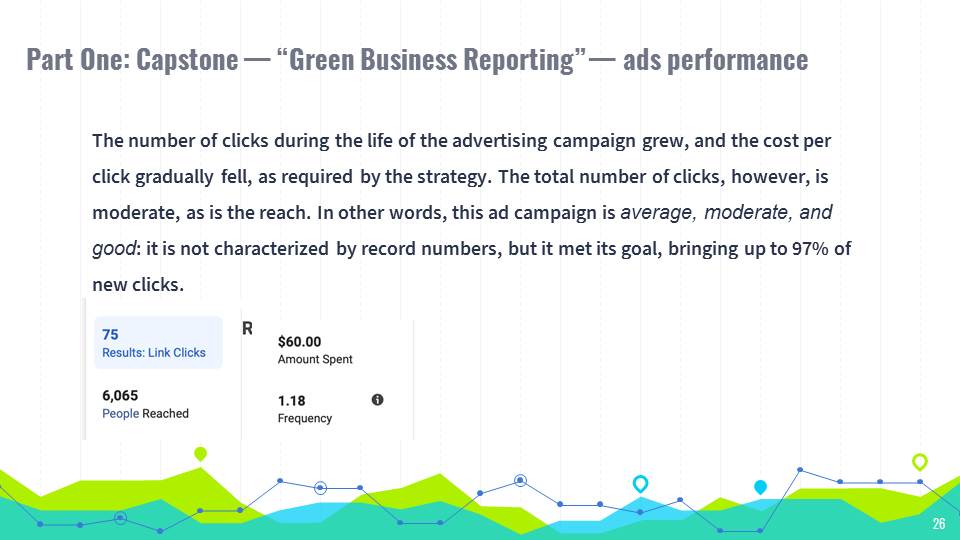
A close look at the metrics of this campaign yields some results about its effectiveness. The total number of clicks was 75, of which 73 were unique. 97%, therefore, of the total number of clicks belonged to different users. The total reach was 6,065, and the number of impressions was 7,183. Thus, for this campaign, these are moderate or even slightly above average results. Considering the total campaign budget and the number of clicks received, the average CPR was 0.80 per link click.
A/B tests
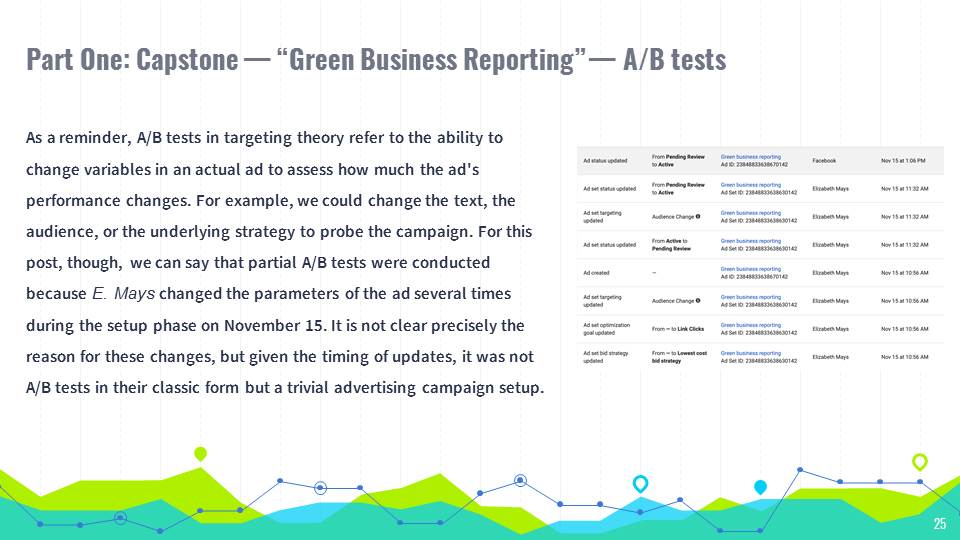
As a reminder, A/B tests in targeting theory refer to the ability to change variables in an actual ad to assess how much the ad’s performance changes. For example, we could change the text, the audience, or the underlying strategy to probe the campaign. For this post, though, we can say that partial A/B tests were conducted because E. Mays changed the parameters of the ad several times during the setup phase on November 15. It is not clear precisely the reason for these changes, but given the timing of updates, it was not A/B tests in their classic form but a trivial advertising campaign setup.
Ads performance
The number of clicks during the life of the advertising campaign grew, and the cost per click gradually fell, as required by the strategy. The total number of clicks, however, is moderate, as is the reach. In other words, this ad campaign is average, moderate, and good: it is not characterized by record numbers, but it met its goal, bringing up to 97% of new clicks.
Breaking down
The total number (about results) of males was 41 (55%), and females were 33 (44%). For coverage, impressions, and CPR, the demographic breakdown was as follows:
- CPR: $0.82 (M) and $0.79 (F),
- Reach: 3,480 or 57% (M) and 2,558 or 42% (F),
- Impressions: 4,168 or 58% (M) and 2,982 or 42% (F).
* For all sections, the 55-64 age group was the leading group, and the 18-24 group was the lagging group.
Audience targeting
The audience used for this advertising campaign consisted of the following characteristics:
- United States;
- 22-64;
- Interests: Broadcast journalism, Journalism, Digital journalism or Investigative journalism, Job title: Journalist/Writer.
* exc.: People who currently like or follow Donald W. Reynolds Center for Business Journalism.
Google Ads Measurement — 2021 Capstone Fall
Groups
There were three groups in the present ad campaign:
- Story Ideas;
- Resources for Journalists;
- Financial Journalists.
* Overall targeting for the entire campaign was conducted on United States.
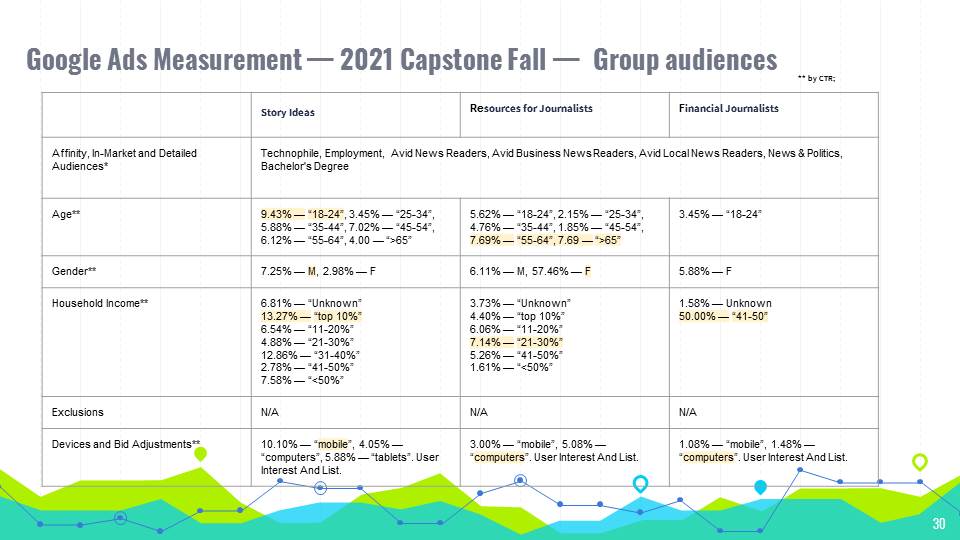
Group audiences
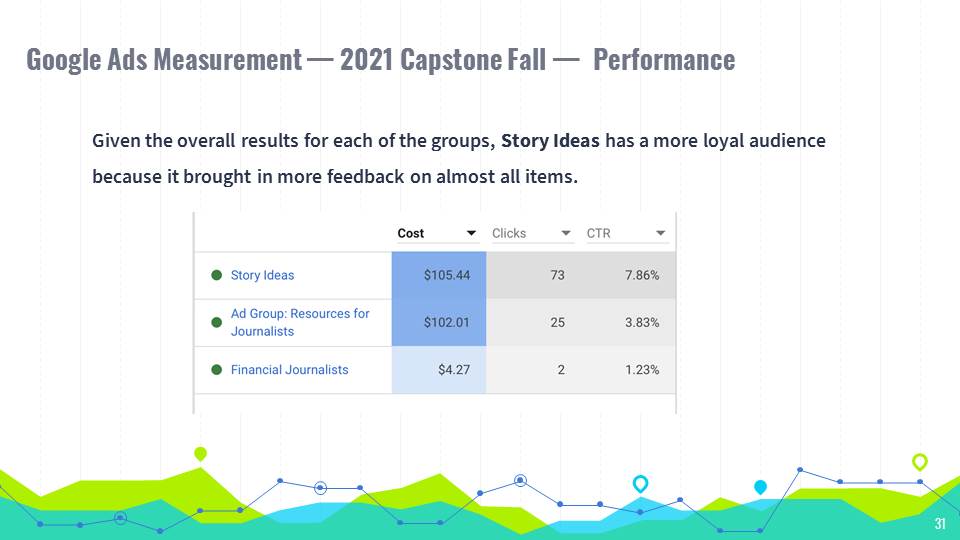
Performance Analysis
Given the overall results for each of the groups, Story Ideas has a more loyal audience because it brought in more feedback on almost all items.
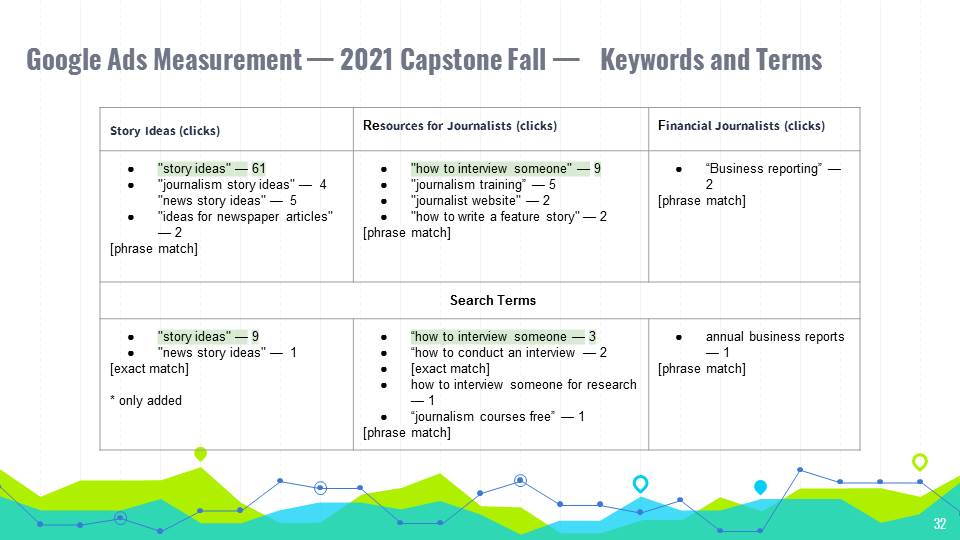
Keywords and Terms
Performance
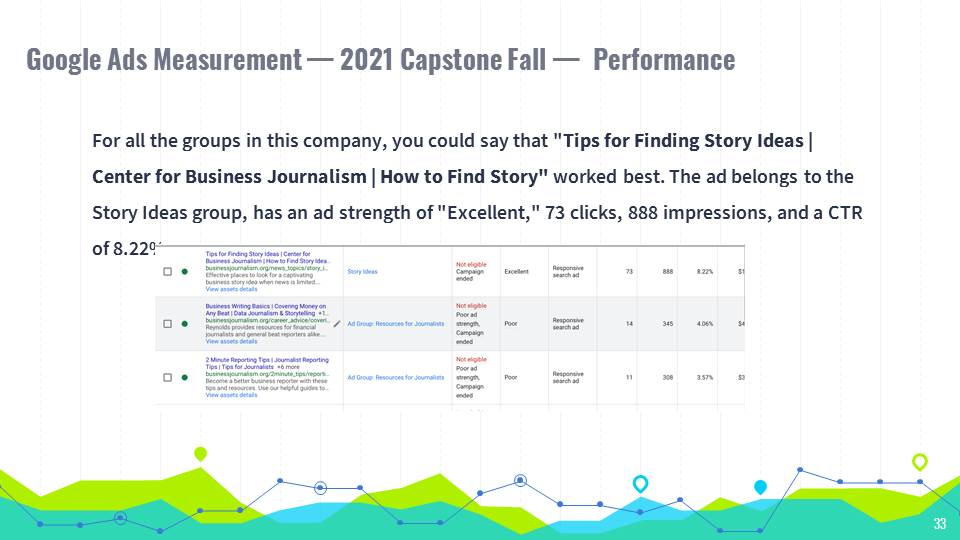
For all the groups in this company, you could say that “Tips for Finding Story Ideas | Center for Business Journalism | How to Find Story” worked best. The ad belongs to the Story Ideas group, has an ad strength of “Excellent,” 73 clicks, 888 impressions, and a CTR of 8.22%.
Inefficiency
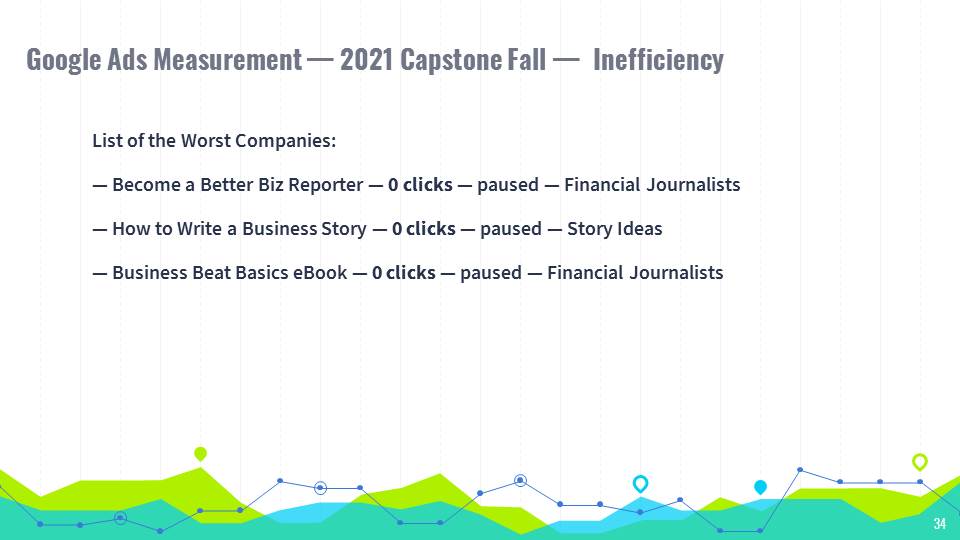
List of the Worst Companies:
- Become a Better Biz Reporter — 0 clicks — paused — Financial Journalists;
- How to Write a Business Story — 0 clicks — paused — Story Ideas;
- Business Beat Basics eBook — 0 clicks — paused — Financial Journalists.
Analytics
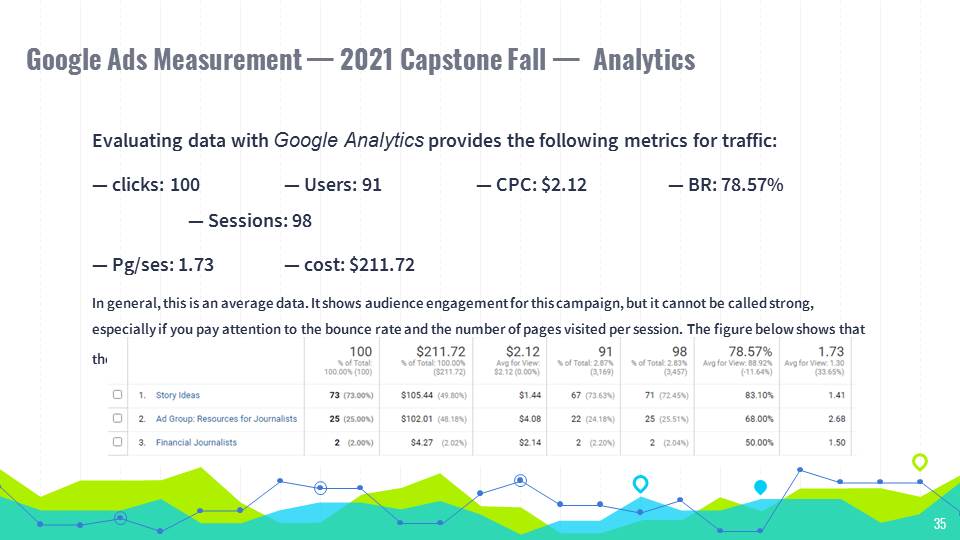
Evaluating data with Google Analytics provides the following metrics for traffic:
- clicks: 100;
- Users: 91;
- CPC: $2.12;
- BR: 78.57%;
- Sessions: 98;
- Pg/ses: 1.73;
- cost: $211.72.
In general, this is an average data. It shows audience engagement for this campaign, but it cannot be called strong, especially if you pay attention to the bounce rate and the number of pages visited per session. The figure below shows that the best group in this ad across all columns is Ad Group: Resources for Journalists. Date: 11/15/21-11/25/21.
Paid Search
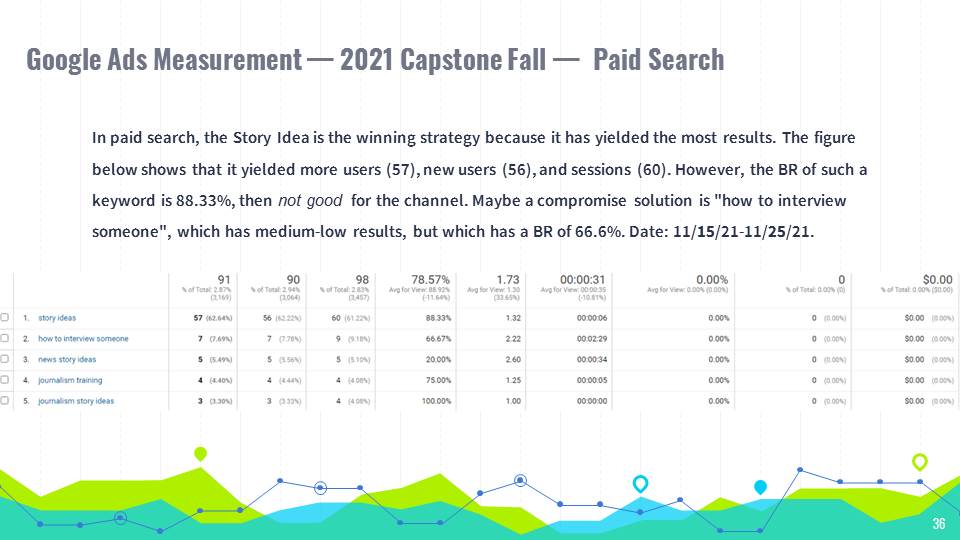
In paid search, the Story Idea is the winning strategy because it has yielded the most results. The figure below shows that it yielded more users (57), new users (56), and sessions (60). However, the BR of such a keyword is 88.33%, then not good for the channel. Maybe a compromise solution is “how to interview someone”, which has medium-low results, but which has a BR of 66.6%. Date: 11/15/21-11/25/21.
Strategy Development
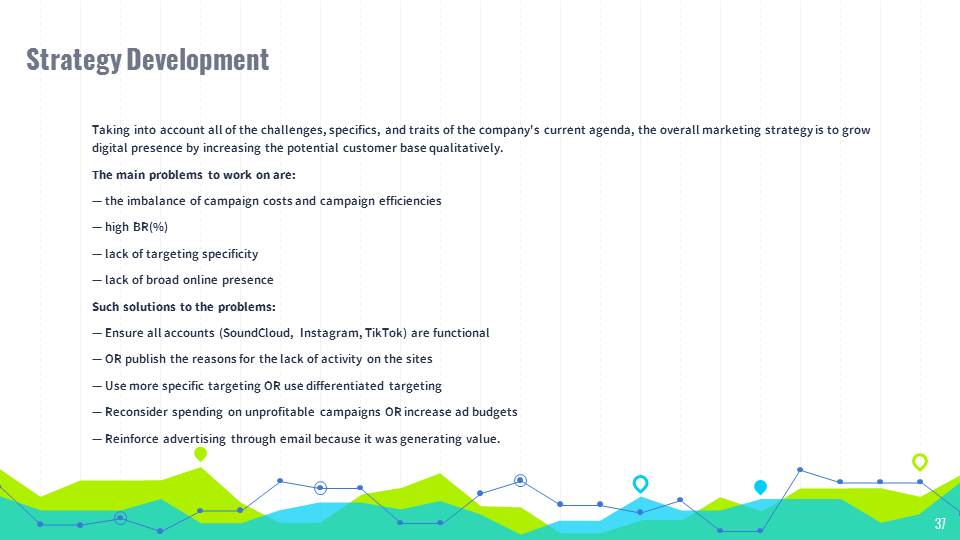
Taking into account all of the challenges, specifics, and traits of the company’s current agenda, the overall marketing strategy is to grow digital presence by increasing the potential customer base qualitatively.
The main problems to work on are:
- the imbalance of campaign costs and campaign efficiencies;
- high BR(%);
- lack of targeting specificity;
- lack of broad online presence.
Such solutions to the problems:
- Ensure all accounts (SoundCloud, Instagram, TikTok) are functional;
- OR publish the reasons for the lack of activity on the sites;
- Use more specific targeting OR use differentiated targeting;
- Reconsider spending on unprofitable campaigns OR increase ad budgets;
- Reinforce advertising through email because it was generating value.
Extra Credit Opportunity 3
Twenty-six (only three active) ad campaigns were launched for Google, and four for Facebook: all of these ads were made this fall:
The CTR for Google ads was much higher because the impressions for Facebook were about ten times higher. Clicks were generally similar. It seems that the higher the campaign budget was spent, the more feedback was received. The least amount of feedback was received from those ads where the geographic targeting was fairly narrow. The best ones:
- Story Ideas (Google);
- Green business reporting (Facebook).
Consequently, the following recommendations can be made:
- Increase the budget for advertising campaigns.
- use automatic targeting.
- Conduct A/B tests to modify ineffective ads.
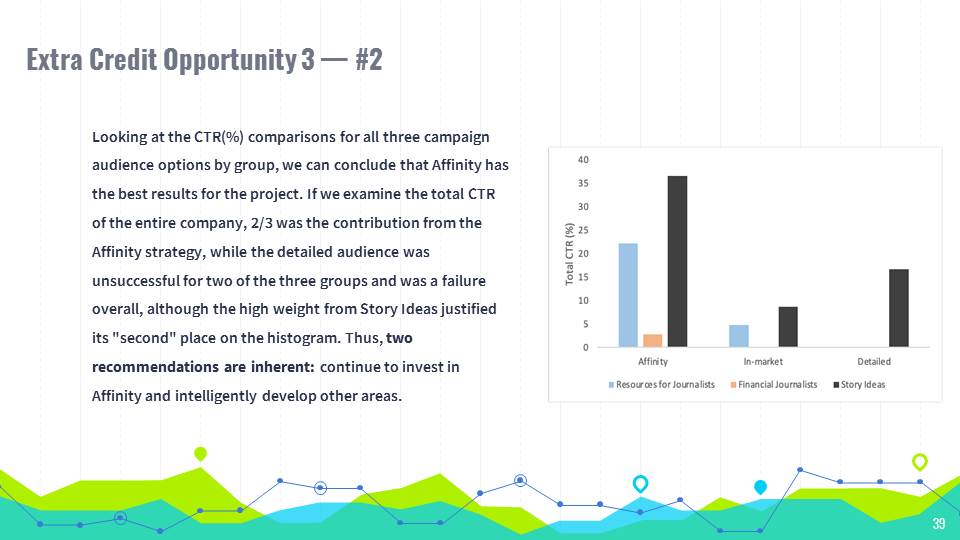
Looking at the CTR(%) comparisons for all three campaign audience options by group, we can conclude that Affinity has the best results for the project. If we examine the total CTR of the entire company, 2/3 was the contribution from the Affinity strategy, while the detailed audience was unsuccessful for two of the three groups and was a failure overall, although the high weight from Story Ideas justified its “second” place on the histogram. Thus, two recommendations are inherent: continue to invest in Affinity and intelligently develop other areas.
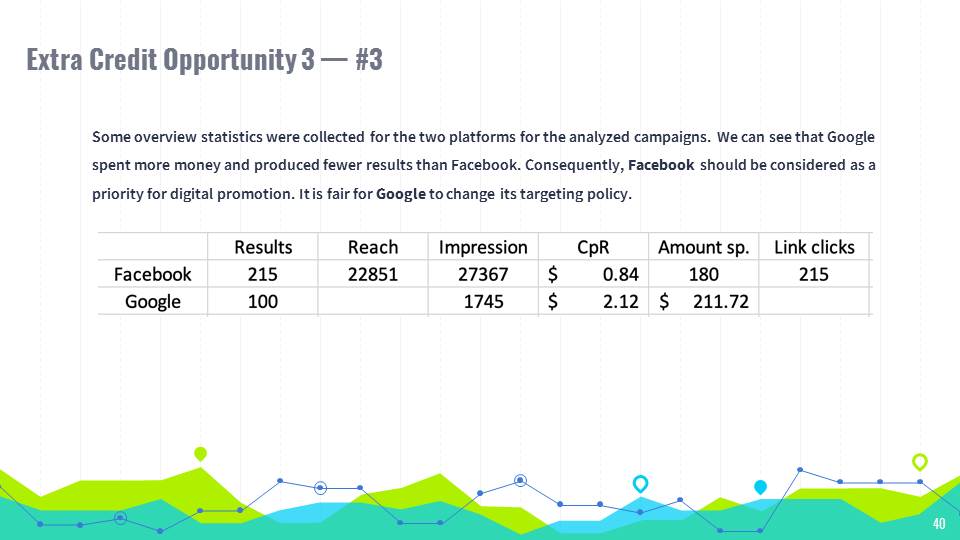
Some overview statistics were collected for the two platforms for the analyzed campaigns. We can see that Google spent more money and produced fewer results than Facebook. Consequently, Facebook should be considered as a priority for digital promotion. It is fair for Google to change its targeting policy.
