The Australian economy in the 1990s and 2000s
There was high growth in investment and employment in the 2000s. Before the global financial crisis, the Australian economy had experienced “17 consecutive years of economic growth” (OECD, 2010, p. 2). Brown & Davis (2009) discuss that the Australian economy did not experience the severity of the 2008 financial crisis because it had operated under an economic surplus for several years. It had also maintained a positive balance of payment for several years.
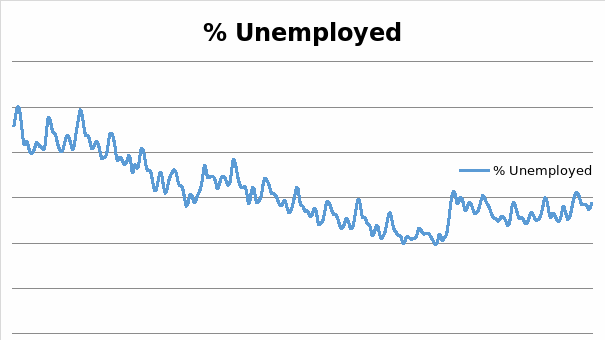
Eslake (2006) explains that Australia’s unemployment rate went above 11% in 1992. The unemployment rate had been above 3% once since the the1940s went above 4% in the 1970s, 1980s, and 1990s recessions. During the 2008 financial crisis, unemployment increased (Table 1).
Table 1. Source: simple averages calculated from ABS data on monthly values (Labor Force Australia, Cat. 6202.0., 2013).
According to graph 1, it has not gone back to the level it was before the financial crisis.
Australia’s GDP per capita had fallen by about 8% in the 1900s following the impact of the three recessions. The inflation rate was above 10% in the early 1990s (Eslake, 2006). The economy performed well after recovering from the early 1990s recession. The inflation rate and the unemployment rate had been maintained at lower levels.
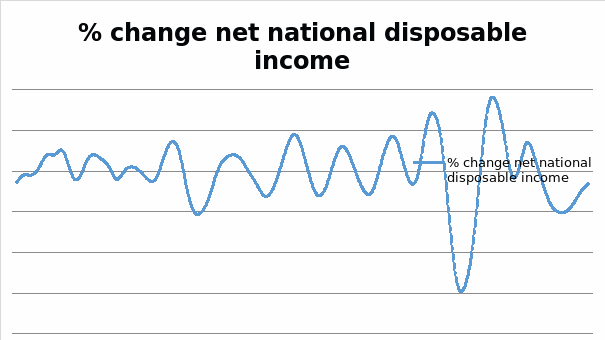
Table 2: Disposable income % change. Source: ABS (Australian National Accounts: National Income, Expenditure and Product, Cat. 5206.0., 2013).
Graph 3 shows a major fall in net national disposable income during the financial crisis (from Table 2). The economy is currently operating under a deficit. A deficit comes from measures taken by the government to prevent a recession.
The Reserve Bank has struggled to maintain the inflation rate below 3%. Eslake (2006, p. 26) discusses that “in 1993, the Reserve Bank adopted an inflation rate target of 2%-3% per annum.” In 1996, the target was made to become an agreement between the government and the governor of the Reserve Bank.
Eslake (2006) explains that the Reserve Bank uses the cash rate targets similar to those used in the U.S. The cash rate has been lower since the early 1990s recession. Eslake (2006) explains that Australian inflation rates were high and unstable before the 1990s because the monetary policy was used to target multiple objectives. Its ineffectiveness is also blamed on political influence. In 1996, the impact was removed when the Reserve Bank was allowed to carry out its policies without consulting with the government so long as they meet the set target.
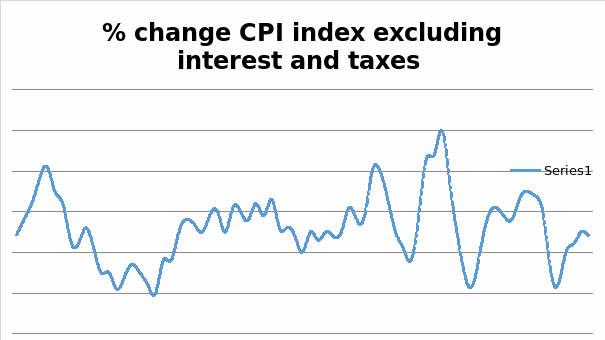
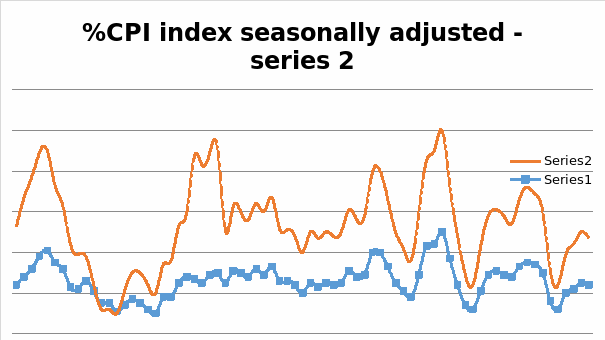
Table 3. Consumer price index % change.
The Australian Government implemented trade policies that allowed the country to compete freely with the world. The opening up of the commodities market started in the 1980s. In the 1990s, it was expanded under the National Competition Policy Framework which reduced international trade barriers (OECD, 2010). The impact of the framework was an additional AUD 20 billion to the Australian economy through increased productivity. Following the high rate of expansion of China and India, Australia performed well in international trade. OECD (2010) reports that the terms-of-trade increased by more than 65% between 2003 and 2008. The export sector declined during the recession (Graph 7).

Australian labor productivity is considered to have improved by 3.3% from the 1993-94 to 1998-99 fiscal years. The high rate of increase in productivity during the period is considered to have reduced the difference in productivity levels between Australia and the U.S. The government also implemented policies that reduced the fixing of wages under a central system. The policies include the Hawke-Keating Labor government of 1991 and the Workplace Relations Act of 1996 (OECD, 2010). Parham (2013, para. 2) reports that “labor income grew faster in the 2000s than in the 1990s.” The increased productivity was supported by a mining boom.
Eslake (2006) discusses that 41% of Australian employees had their salaries set through an agreement between an employer and a group of employees such as unions. A further 39% was set through agreements between employers and individuals. It reduced the setting of salaries by awards. Awards were standards set by the government. Union membership reduced from 57% in the 1980s to less than 23% in 2004. Membership in the private sector was lower than 18% in 2004 but it was greater than 46% in the public sector. The flexibility of the wage rate is associated with favorable terms for employers and a low unemployment rate.
Major challenges
Macroeconomic instruments work through influencing other economic factors. McDonald & Morling (2011) explain that sometimes the monetary policy has a lag time. The intended impact on economic activity is not felt immediately. Sometimes it may take a period of about 2 years to reach the target. The impact is spread through a stream of effects on other macroeconomic factors.
When the cash rate is reduced during a recession, banks remain restrictive in lending and may charge higher rates to match the higher risk.
The Australian dollar became weaker as a result of the reduced cash rate. It resulted in a lower value for Australian exports when the terms of trade were also declining. McDonald & Morling (2011) discuss that the reduced foreign exchange rate resulted in a counterbalancing growth. Australian commodities gained international competitiveness that may have resulted in increased exports as its currency lost value.
The export sector lacks diversity as it is reliant on mining. Lack of diversity exposes the country’s balance of payments to wide fluctuations in case the price of minerals falls or rises. In a diverse sector, a fall in prices in one commodity is offset by the rise in prices of another product. It creates stability for the balance of payments.
Impact of the global financial crisis
The impact of the 2008 financial crisis was felt through the fall of prices of major assets. Financial assets reported a major drop in prices all across the globe (McDonald & Morling, 2011). Some of the major financial institutions and insurance companies that we’re unable to cover losses collapsed. There was a reduction in global capital inflows from 18% of global GDP in 2007 to 2% in 2009 (McDonald & Morling, 2011). A big proportion of the fall in cash inflows was derived from a large drop in cash transfers from advanced economies. McDonald & Morling (2011, p. 6) explain that world economic growth fell from over 5% in 2006 to -0.5% in 2009.” Consumers were taking precautions by keeping money for future consumption.
Brown & Davis (2009) explain that Australia’s economy was considered vulnerable because asset-backed securities had been issued widely. The compulsory pension scheme invested vast amounts in securities whose value was falling. It lost value through financial assets. Their value moved from $1.2 trillion in 2007 to $1.05 trillion by the end of 2008. The four biggest banks raised capital in the international financial markets. These banks were holding about 65% of Australian resident assets and raised about 50% of their capital from offshore financial markets (Brown & Davis, 2009). Several financial institutions that operated in Australia collapsed. Some of the firms that failed include Opes Prime, Babcock and Brown, Timbercorp, Great Southern, and Tricom Securities.
Even though the Australian economy showed signs of recovery in early 2009, the market prices of stocks had fallen by about 41% compared to prices in 2007 (Brown & Davis, 2009). Following the global financial crisis (GFC), the Reserve Bank implemented measures that would back the financial system to regain the lost investor confidence. The Reserve Bank increased authorized deposit-taking institutions (ADIs) which reduced the loss of value of securities. The government also issued guarantees for securities issued by the ADIs (Graph 8).

The government charged a fee for providing the guarantee for large deposits. It also directed the Australian Office of Financial Management (AOFM) to purchase a large number of mortgage-backed securities. These measures are considered to have saved banks to continue borrowing and lending. Guaranteeing securities enhanced the stability of the Australian financial markets.
Concept of instruments and targets
In response to the falling prices of financial assets, the government issued guarantees to deposits and loans. It is not a common macroeconomic instrument. During the financial crisis, interest rates as a macroeconomic instrument failed to be effective. The government issued a lower cash rate but banks became more restrictive in issuing loans. They continued to demand higher interest rates for loans. In that case, interest rates as a macroeconomic instrument had failed to meet their target of increasing economic activity by making finance easily available. The government had to use guarantees to bring back the investor and consumer confidence.
In response to the withdrawal of GE Money Motor Solutions and GMAC from Australia, the government and the four major banks pooled together to finance car dealers (Brown & Davis, 2009). It is increased government expenditure aimed at increasing investment and employment.
The government through the Australian Prudential Regulatory Authority (APRA) banned short-selling of stocks in the Australian Securities Exchange (ASX) for about a year. It was aimed at reducing the volatility of the stock market.
The reserve bank controls the inflation rate using the cash rate as its monetary policy instrument. It uses the overnight lending rate to control bank interest rates. A high cash rate makes banks to reduce lending by demanding higher interest rates on loans. The money supply is reduced when banks reduce lending. Eslake (2006, p. 26) explains that the cash rate is “reflected very quickly in interest rates charged to borrowers.” High-interest rates restrict borrowing and reduce the money supply.
The government engages in open market operations where it can sell or buy bonds to maintain money circulation at the desired level. Issuing bonds to the public tend to reduce money in circulation. When the Reserve Bank wants to reduce money in circulation, it may sell bonds to the public as a monetary tool. When it wants to increase the money supply it may recall some of the bonds.
Bonds have been used to finance government projects as a fiscal policy instrument. They also act as monetary tools. Australian government issuance of bonds increased to finance the budget deficit after the financial crisis (see graph 7 & 9).

In this case, government expenditure is used to increase aggregate demand. Increased aggregate demand triggers investment and creates additional employment opportunities. Increased government expenditure is another instrument that targets increased employment.
The government’s reaction to the GFC was to use a $10.4 billion fiscal stimulus package. Most of the money was spent as cash transfers to low and middle-income workers (McDonald and Morling, 2011). Other stimulus packages include a $15.2 billion COAG funding package, $4.7 billion Nation Building package, and $42 billion Nation Building Jobs Plan package (Access Economics, 2008). The government spent an additional $800 million in the Community Infrastructure Program and $480 as grants to the local government in the first quarter of the 2008/2009 fiscal year (Bureau of Infrastructure, Transport and Regional Economics, 2009).
Economic theory in Australia’s current policy
Australia aims at keeping a moderate unemployment rate, low inflation rate, and low public debt to GDP ratio (Commonwealth of Australia, 2012). There is a forecast for a moderate surplus in the 2013/2014 fiscal year. Projections indicate that the terms of trade are declining. The government has received lower tax revenues but maintains the tax rates to enhance growth and employment. OECD (2013) reports that reducing tax expenditure increases economic growth.
The Australian government’s response to the financial crisis is different from its initial plan of maintaining a surplus. Leeson (2000) explains that the government would reduce expenditure which will result in a surplus. A surplus may reduce the government’s need to borrow from the financial markets through bonds. When the government withdraws its demand from the financial market, interest rates fall. It results in increased investment and employment rates. It was the government policy before the financial crisis which follows classical economics.
The government applied Keynesian multiplier economics after the crisis. The government induces economic activity through increased expenditure which results in a budget deficit. Through the Keynesian multiplier, aggregate demand increased by government expenditure increases employment (Leeson, 2000). Increasing employment through an expansionary fiscal policy is associated with inflation. Leeson (2000, p. 141, quoting Friedman) explains that “only a modest reduction in output and employment will be the side effect of reducing inflation to single figures.” On the other hand, a decision to reduce inflation would create favorable conditions for investment and economic growth in the future. The government plans to go back to the initial plan of reduced expenditure and a surplus to manage inflation. The government expects to have a budget with a surplus by the year 2014/2015.
The impact of the stimulus packages was considered to be offset by the impact of the declining exchange rate, price variations, and the monetary policy. The forecast was to increase economic growth by 2.75% (Bureau of Infrastructure, Transport and Regional Economics, 2009). Australia’s stimulus package was second in size as a proportion of the GDP. Compared with other developed countries, South Korea had the highest percentage. Analysts argue that Australians saved cash transfers instead of spending them in anticipation of worsening economic conditions. It is a rational behavior during times of crisis. They did not save in banks as reports indicate that banks did not report increased savings (McDonald & Morling, 2011). It may have resulted in increased hoarding of cash. In that case, economic activity would not match increased government expenditure.
McDonald & Morling (2011) discuss that the cash rate fell from 7.25% in early 2008 to 3% in early 2009. After the GFC, the effectiveness of the cash rate was enhanced by Australia having a flexible mortgage rate that responds to the cash rate. The cash rate was again increased towards the end of 2009 with an aim of avoiding inflation (OECD, 2010). Expansive deficit financing is considered to have inflationary pressures.
Reinhart & Rogoff (2010) explain that debt levels above 90% of GDP have an impact on inflation. Such high levels of debt also reduce the growth rate. The Australian government policy has prioritized the management of inflation since the Rudd government took office (Anderson & Fenna, n.d.). The government maintains low deficit levels but has projections for keeping on with a surplus as in the years before the financial crisis (see graph 10).

Exports are reliant on mineral resources in Australia which makes the sector exposed to shocks. The government has been encouraging diversity in export products. However, Australia has been blamed by Asian countries for increasing the number of screening procedures for imports.
OECD (2013) explains that GDP per capita is widely used to compare countries because it is easily available (see graph 11). Other indicators of well-being may be used such as rising inequality. Australia is among the countries with increasing income differences.

Conclusion
During the GFC period, the Australian government changed its macroeconomic policy. It shifted from that of maintaining inflation through budget surplus to that of increasing investment and employment through deficit financing. Deficit financing is associated with inflation. The high debt to GDP ratio also reduces growth when it reaches higher percentages. After avoiding a recession through increased expenditure, the government plans to go back to its initial plan where it maintains a budget surplus. It is implementing tax expenditure reduction policies. Australia has experienced economic stability and a higher growth rate compared to other developed economies through its policy that eliminates a budget deficit.
Reference List
Access to Economics. (2008). The impact of the global financial crisis on social services in Australia. Canberra: Access Economics. Web.
Anderson, G., & Fenna, A. (n.d.). Australian federalism and the global economic crisis of 2008-09. Web.
Australian National Accounts: National Income, Expenditure and Product, Cat. 5206.0. (2013). Web.
Brown, C., & Davis, K. (2009). Australia’s experience in the global financial crisis. Web.
Bureau of Infrastructure, Transport and Regional Economics. (2009). The global downturn – some implications for the Australian local governments. Canberra: BITRE. Web.
Commonwealth of Australia. (2013). Economic statement. Canberra: Commonwealth of Australia. Web.
Eslake, S. (2006). An introduction to the Australian economy. Web.
Labor Force Australia, Cat. 6202.0. (2013). Web.
Leeson, R. (2000). Inflation, disinflation and the natural rate of unemployment: A dynamic framework for policy analysis. Web.
McDonald, T., & Morling, S. (2011). The Australian economy and the global downturn: Part 1- Reasons for resilience. Web.
Measures of consumer price inflation. (2013). Web.
OECD. (2010). Australia: Moving to a seamless national economy. OECD Policy Brief, Feb, 1-8. Web.
OECD. (2013). Economic policy reforms: going for growth. Paris: OECD. Web.
Parham, D. (2013). Labour’s share of growth in income and prosperity. Web.
Reinhart, M. C., & Rogoff. S. K. (2010). Growth in a time of debt. American Economic Review, 100(2), 573-578. Web.