Decisions form a critical part of management in an organization. Both individuals and organizations often make decisions on particular issues. Each decision that is taken by an individual or an organization is associated with some consequences. The impacts of a decision can be positive or negative.
Consequently, it is important to evaluate the various available options in order to arrive at the best decision. This calls for an effective and efficient decision-making tool or technique. The use of a reliable decision-making tool enables policy makers to avoid failures and conserve scares resources (Haan & Koppelaars, 2007). This paper focuses on the use of Venn diagrams as a decision-making tool. The characteristics, applications and limitations of Venn diagrams will be illuminated.
Characteristics of Venn Diagrams
A Venn diagram is a decision-making tool that allows the decision maker to analyze the relationship between two or more variables (Haan & Koppelaars, 2007). A typical Venn diagram consists of overlapping circles or closed curves. The circles should be symmetrical or equal in size. The use of Venn diagrams is based on the set theory (Haan & Koppelaars, 2007).
According to the set theory, the items to be compared are classified into groups known as sets. The items found in a particular set are generally referred to as elements of the set. The elements of a particular set must have similar characteristics. This means that items must be sorted before being assigned to a given set. It is important to use an accurate and reliable method to sort and classify the variables since it will improve the integrity of the results of the analysis.
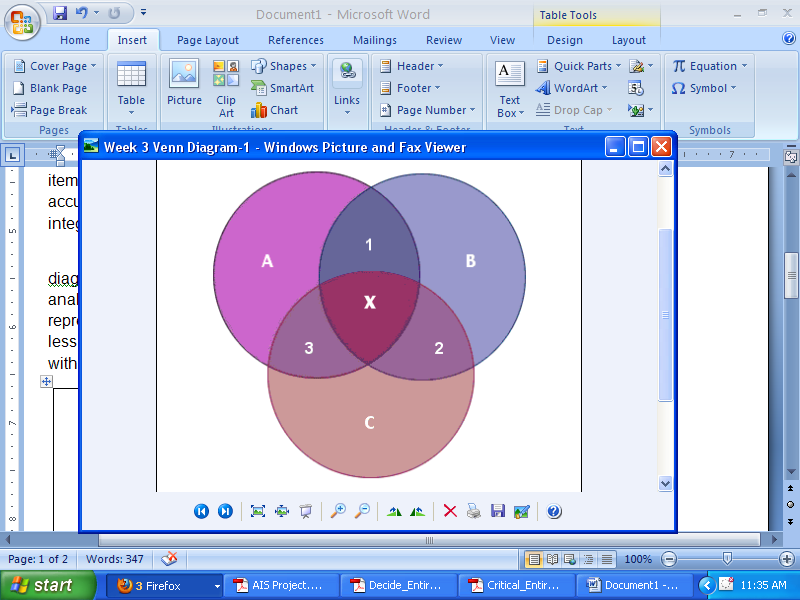
The various sets in a Venn diagram are represented by circles (William & Edwards, 2004). A typical Venn diagram consists of two or three sets. However, Venn diagrams can also be used to analyze more than three sets at the same time. In this case the sets are usually represented by other shapes such as ellipses or triangles in order to reduce the visual complexity the diagram (William & Edwards, 2004). Figure 1 below shows a Venn diagram with three sets.
The sets are represented by the circles marked A, B and C. The numbers 1, 2 and 3 shows the areas in which the circles overlap. According to the set theory, the numbers show the union of various sets (Haan & Koppelaars, 2007). For example, the area marked 1 represents the union of A and B, area 2 represent the union of B and C while area 3 represent the union of A and C. The elements that are located in the areas marked 1, 2 and 3 have common characteristics.
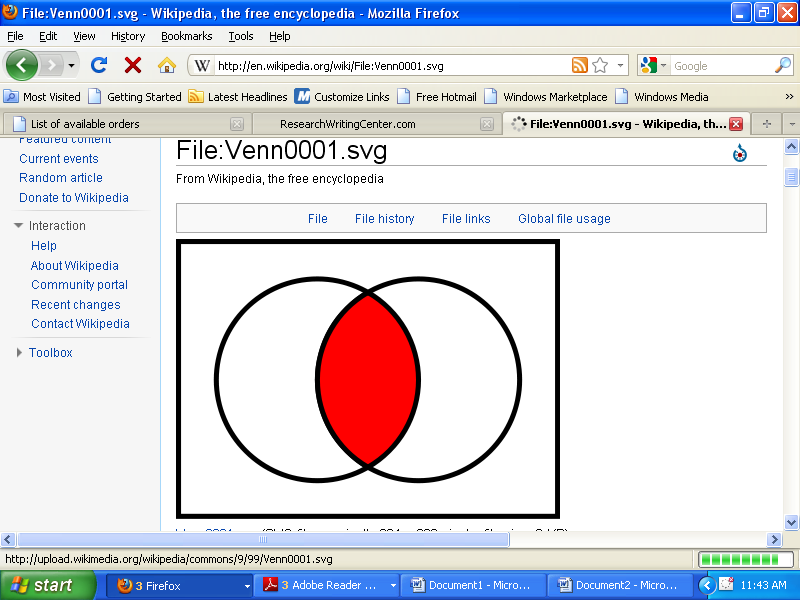
The area marked x represent the union of A, B and C. This means that the elements found in this area have common characteristics. Figure 2 shows a Venn diagram with two sets. The sets are represented by the white circles. The red area shows the intersection between the circles. The elements in the red area have the same attributes. In both diagrams, the area outside the circles represents the elements that are not found in any of the sets and is referred to as the null set.
Figure 1 and Figure 2
Application
Venn diagrams are used to analyze the hypothetical relationships that exist between sets (Haan & Koppelaars, 2007). The variables to be analyzed are represented by the sets (William & Edwards, 2004). The Venn diagrams are used in analyses that involve logic, statistics and probability. The analysis begins with the identification of the variables to be analyzed.
At the second stage, the various characteristics of the variables are indentified and listed (William & Edwards, 2004). The variables with similar characteristics or attributes are classified in the same set. Thus the variables become the elements of the set under which they have been classified. For example, in figure 1 the elements found in the areas marked A, B and C, have unique characteristics.
This means that they do not share any common attributes. However, it is possible to find variables or elements whose characteristics can be found in more than one set. Such elements are found at the areas where the circles intersect. For example, in figure 1the elements found in the area marked 1have attributes that are associated with both set A and B. The last stage of the analysis involves comparing and contrasting the elements in the Venn diagram according to their respective attributes.
Example
The population of America consists of Whites, Blacks and the rich. In figure 1, set A can represent the Whites. Set B can represent the Blacks while the rich can be represented by set C. Thus the African-Americans will be found in the area marked 1 since they have attributes of both races.
Blacks who are also rich will be found in the area marked 2 since the area consist of elements whose attributes are found in set B and C. Whites who are also rich will be found in the area marked 3. Finally, the area marked X consists of African-Americans who are also rich since the elements in this area have the attributes of all sets. Members of the population who do not have any of the above attributes will be found in the area outside the circles.
Advantages and Limitations of Venn Diagrams
Advantages
First, the diagrams are easy to construct and interpret (Haan & Koppelaars, 2007). The Venn diagrams represent the outcome of an analysis of the characteristics of a given set of variables. Thus it is easy to get the needed information without further analysis. Second, the use of Venn diagrams help in eliminating the bias attributed to prejudice and personal opinion.
This is because the classification of elements in the sets depends on facts that describe the attributes of the elements (William & Edwards, 2004). Finally, Venn diagrams can be used in any decision making process that involves determining the relationship between attributes of variables. Therefore, Venn diagrams can be used in any analysis that involves comparing and contrasting the attributes of variables.
Limitation
First, the size of each set can not be determined in a Venn diagram (Haan & Koppelaars, 2007). For example, in the above illustration it is only possible to get information on the characteristics of the population of America. However, it is not possible to tell the number of Whites or Black form the Venn diagram.
Second, Venn diagrams tend to be visually complex when several circles are used to represent sets. This makes it difficult to interpret the outcome of the analysis. Finally, Venn diagrams depend on other tools of analysis such as classification and statistical analysis.
Without such tools, it is not possible to get the information that is needed to develop various sets. Besides, the information obtained form the Venn diagrams will not be reliable if the classification was not done correctly (Haan & Koppelaars, 2007). Thus Venn diagrams can not be used in cases whereby the information on the size of the set is needed. It is also not possible to use Venn diagrams for mathematical analysis. In the contrary, mathematical analysis can be used to get information on the attributes of elements in a given set.
References
Haan, L., & Koppelaars, T. (2007). Applied mathematics for database professionals . New York: Apress.
William, A., & Edwards, F. (2004). Cogwheels of the mind: the story of Venn diagrams. Balitmore: JHU Press.

