The real GDP and household consumptions are critical elements in computing consumption function. To illustrate real GDP and real household consumption of Estonia GDP, GDP deflator, household consumption, and CPI has to be collected as independent variables. Reflectively, real GDP measures the output of an economy at a constant price. Thus, in order to obtain this measure, nominal GDP has to be divided by the GDP deflator and multiplied by a constant 100 (Mankiw, 2010, p. 25). This is illustrated in the formulae; GDP of Estonia / GDP deflator of Estonia) × 100.
For instance, in 2010, the real GDP of Estonia was 174262.67 derived from the above formulae. Numerically, this can be illustrated as follows;).
(226,890/130,2)*100≈174162,67
The equation to compute the real household consumption consists of dividing household consumption by CPI and multiplying the result by 100; Household Consumption of Estonia / CPI of Estonia) × 100. Besides, following the same formulae, the real household consumption in Estonia in the year of 2010 was 89088.61 derived as indicated below;).
(112,608/126,4)*100≈89088.61
The formula was used to calculate the real household consumption and real GDP of Estonia over the other years and their results can be seen in the table below.
Table 1: Data of Real Household Consumption and Real GDP in Estonia
Note: Data computed by authors using information from International Monetary Fund 2011 (“International Monetary Fund Annual Report 2011”, p.310).
Analysis
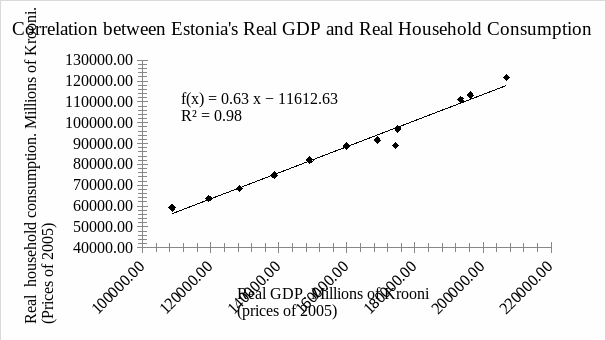
To visualize this data a scatter graph was used to represent the correlation between Estonia’s Real GDP and real household consumption. Notwithstanding, the results were used to estimate the linear relationship between these variables. As a result, a line of best fit was plotted in line with the responsive relationship between them as indicated in the following graph.

Note: Graph computed by authors using the information from the Monetary International Monetary Fund 2011 (“International Monetary Fund Annual Report 2011”, p.310).
The line of best fit (r) of a scatter plot estimates the linear relationship between the variable on the x-axis and that of the variables on the y-axis: y = ax + b; where variable a is the slope and b is the y-intercept. The slope measures the degree of change if x variable increases by one unit. This can be computed by deriving the coefficient of correlation using statistical software such as SPSS among others. Besides, the same results can be obtained via using scientific calculator or spreadsheet programs such as Excel. Reflectively, the R script shows how to compute and plot the line of best fit (Kirk, 2007).
Discussion
From the results obtained, the linear relationship indicates moderate dependency since r is greater than 0.5 and smaller than 0.8. When the real GDP increases by 1 million, the Estonia’s households will consume approximately 0.63 millions of each additional Krooni. In addition they will save approximately 0.37 millions in kroonis.
The equation for the line of best fit therefore represents the consumption function as y= 0.626 x – 11,612.625. This function was calculated using the Excel Sheet. The results are represented below.
Household consumption expenditure converted into real terms
- 1999 – (47,817/80,8)*100=59179.46
- 2000 – (53,457/84.0)*100=63639.29
- 2001 – (60,818/88,8)*100≈68488,74
- 2002 – (68,927/92)*100≈74920,65
- 2003 – (76,443/93,2)*100≈82020.39
- 2004 – (85,383/96,1)*100≈88848,07
- 2005 – (97,130/100)*100≈97130
- 2006 – (115,974/104,4)*100≈111086,21
- 2007 – (135,391/111,3)*100≈121645,10
- 2008 – (139,205/122,9)*100≈113266,88
- 2009 – (112,525/122,8)*100≈91632,74
- 2010 – (112,608/126,4)*100≈89088,61
GDP converted into real GDP
- 1999 – (83,842/77,2)*100=108603,63
- 2000 – (96,380/80,7)*100=119429,99
- 2001 – (109,070/84,9)*100=128468,79
- 2002 – (121,673/87,8)*100=138579,73
- 2003 – (136,421/91,5)*100=149093,99
- 2004 – (151,542/94,8)*100=159854,43
- 2005 – (176,956/100)*100=174956
- 2006 – (209,520/108,3)*100=193462,60
- 2007 – (247,646/119,7)*100=206888,89
- 2008 – (252,015/128,4)*100=196273,37
- 2009 – (216,875/128,3)*100=169037,41
- 2010 – (226,890/130,2)*100=174262,67
Conclusion
Real consumption function and GDP are critical towards understanding dependence of one variable to another in calculating deflator effect. Generally, these concepts are vital in forecasting and act as a guide towards actualizing household consumption behaviour over a period of time. Reflectively, the relationship as indicated in the line of best fit shows moderate relationship between the real household consumption and the real GDP.
References
International Monetary Fund Annual Report 2011: Pursuing Equitable and Balanced Growth 2011. Web.
Kirk, R. (2007). Statistics: An Introduction. Alabama: Cangage Learning.
Mankiw, G. (2010). Macroeconomics, New York: Worth Publishers.